Testing a Chart Without Looking at It
A chart function that returns its Figure and Axes can be tested like any other function, by reading what the Axes holds, its title, axis labels, each bar's height and a line's data, with matplotlib's Agg backend set in conftest.py and every figure closed with plt.close.
Journeyman · Python · Updated
After this lesson you can
- Test a chart function that returns (fig, ax) by reading its title and axis labels, each bar's height from ax.patches and a line's get_ydata()
- Set matplotlib's Agg backend in conftest.py and close each figure with plt.close, so chart tests run anywhere with no window
Key takeaways
- Looking at a chart isn't a test; a test checks what the chart says, which a function that returns (fig, ax) hands over.
- ax.get_title(), ax.get_xlabel() and ax.get_ylabel() read the chart's words back as text.
- Each bar is a patch in ax.patches, so len(ax.patches) counts the bars and get_height() reads each one, left to right.
- A line's values come back from ax.get_lines()[0].get_ydata().
- matplotlib.use("Agg") in conftest.py draws in memory with no window, and plt.close(fig) at the end of each test frees the figure.
The Greenway Food Truck's weekly report has a chart of revenue by location, and someone will change the code that draws it: a new color, a tidier title, one more location. Each change can quietly put the bars in the wrong order or the wrong numbers under them. You'll test charts whenever a chart goes into a report, and it's how every exercise in this course has checked yours.
Looking isn't a test
The first check anyone makes is to open the picture and look. That works once. After the next change you'd have to look again, carefully, every bar, and a title that lost a word or two bars that swapped places slip past tired eyes. Comparing the saved PNG pixel by pixel with an approved copy sounds stricter, but it fails when a new matplotlib version draws a letter one pixel differently, though the chart says the same thing.
What matters is what the chart says: its title, its labels, how many bars there are and how tall each one is. matplotlib keeps all of that, as data, in the chart's Axes.
A chart function that hands back (fig, ax)
Here is the report's chart, in sales_charts.py. Like every chart in this course, it starts with fig, ax = plt.subplots(), and it returns both, so a test can look inside:
import matplotlib.pyplot as plt


def revenue_chart(sales):
    """Return (fig, ax): a bar chart of each location's revenue, the most first."""
    revenue = (sales["quantity"] * sales["price"]).groupby(sales["location"]).sum()
    revenue = revenue.sort_values(ascending=False)
    fig, ax = plt.subplots()
    ax.bar(revenue.index, revenue.values)
    ax.set_title("City Park earns the most")
    ax.set_xlabel("Location")
    ax.set_ylabel("Revenue ($)")
    return fig, ax
Every set_ has a get_ that reads the value back. The test uses the same three sales as Testing pandas Functions with Small Tables: 2 Street Tacos at $9.00 and 2 Horchatas at $3.50 at City Park, $25.00, and 3 Elotes at $4.50 at the Stadium, $13.50. Now the chart's words:
def test_revenue_chart_title_and_labels():
    fig, ax = revenue_chart(three_sales())
    assert ax.get_title() == "City Park earns the most"
    assert ax.get_xlabel() == "Location"
    assert ax.get_ylabel() == "Revenue ($)"
    plt.close(fig)
Every part a reader looks at has a call that reads it back:
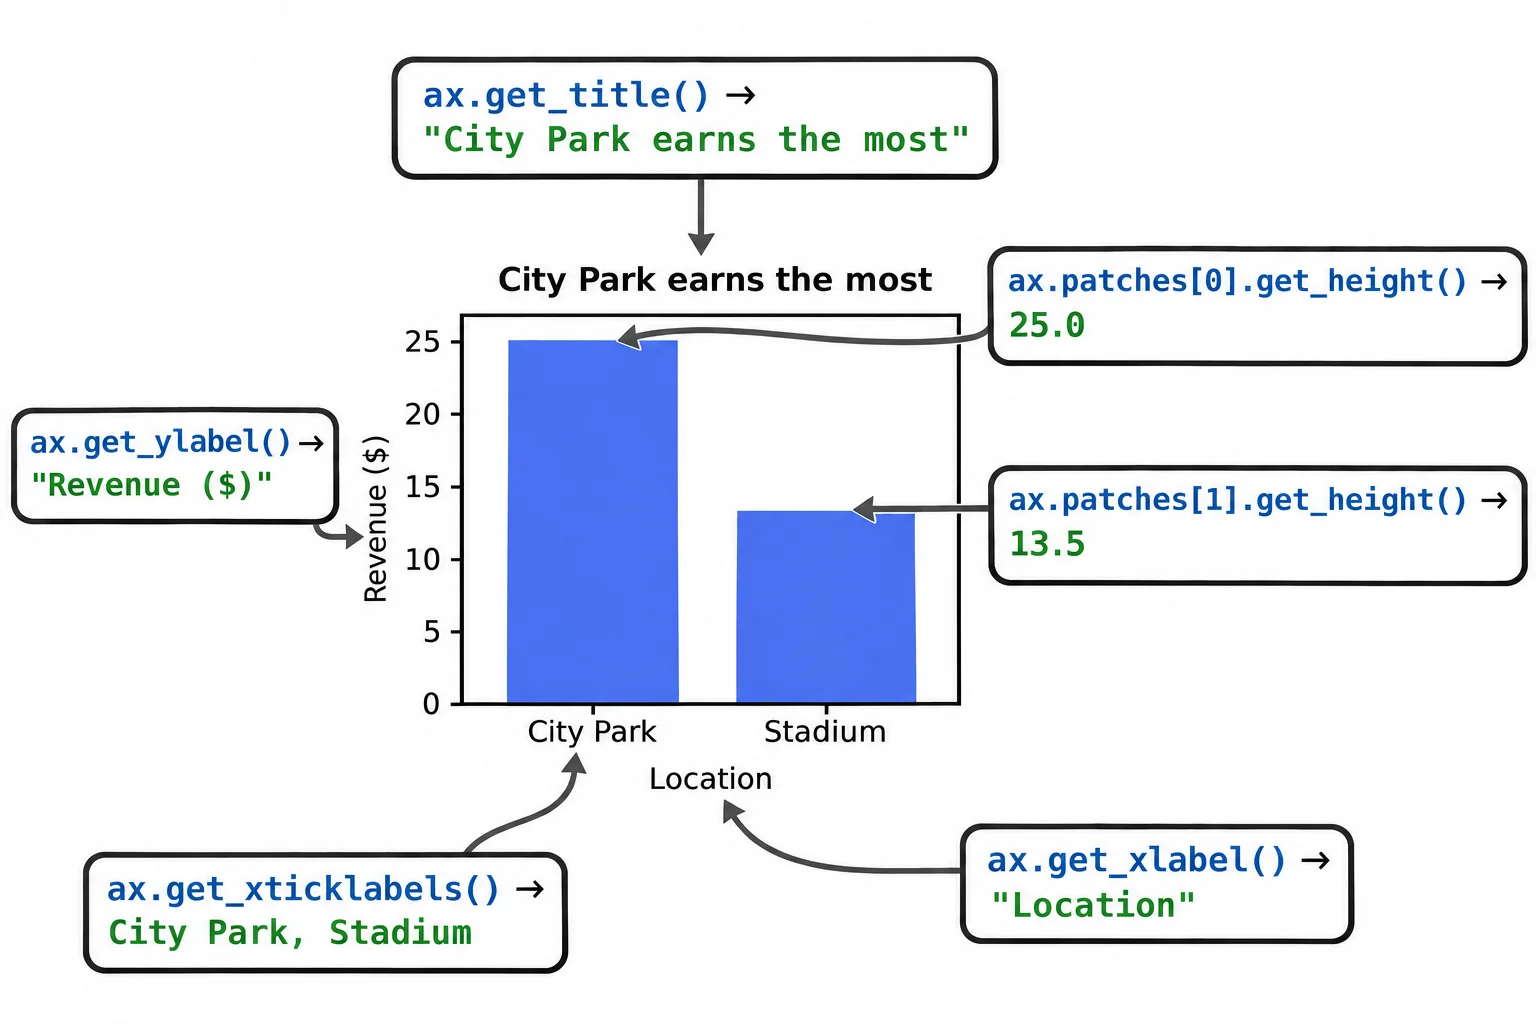
The bars are in ax.patches
matplotlib draws each bar as a rectangle, and calls every filled shape on an Axes a patch. ax.patches lists them, left to right, so len(ax.patches) counts the bars, and each bar's get_height() is its value. The names under the bars come back from ax.get_xticklabels(), one label for each tick, as text with get_text():
def test_revenue_chart_has_a_bar_per_location_the_most_first():
    fig, ax = revenue_chart(three_sales())
    assert len(ax.patches) == 2
    assert [bar.get_height() for bar in ax.patches] == [25.0, 13.5]
    assert [label.get_text() for label in ax.get_xticklabels()] == ["City Park", "Stadium"]
    plt.close(fig)
The heights, in order, are the strongest check: a bar with the wrong value, a missing bar, or bars sorted the wrong way all fail it.
A line's data: get_ydata
A line chart keeps its points in a line object instead of patches. ax.get_lines() lists the lines, and get_ydata() gives one line's values, in the order they were drawn, as a NumPy array; tolist() makes it a plain list. The report's daily_chart(sales) draws revenue by day, and the three sales were on two days, October 28 at City Park and October 30 at the Stadium (the table gets a sold_at column for it):
def test_daily_chart_draws_25_00_then_13_50():
    fig, ax = daily_chart(three_sales())
    line = ax.get_lines()[0]
    assert line.get_ydata().tolist() == [25.0, 13.5]
    plt.close(fig)
get_xdata() does the same for the values along the bottom, here the two dates.
No windows: Agg in conftest.py, and plt.close
matplotlib draws through a backend, the part that turns a chart into something you see. On your computer it may open a window. A test should never wait for a window, and a grader or GitHub's servers have no screen at all. The Agg backend (read "a g g") draws in memory only. Set it once, in tests/conftest.py, a file pytest reads before it runs the tests in that folder:
import matplotlib

matplotlib.use("Agg")
plt.close(fig) at the end of each test matters too. pyplot keeps every figure it makes until it's closed, so a test file that never closes them fills memory, and after 20 figures matplotlib warns:
RuntimeWarning: More than 20 figures have been opened. Figures created through the pyplot interface (`matplotlib.pyplot.figure`) are retained until explicitly closed and may consume too much memory. (To control this warning, see the rcParam `figure.max_open_warning`). Consider using `matplotlib.pyplot.close()`.
With conftest.py in place, python -m pytest runs all three tests, and no window opens:
tests/test_sales_charts.py ... [100%]
Check yourself
2 questions to try on the lesson page.
So what
A chart is data before it's a picture, so a test can read its title, its bars and its line and prove the report says what you meant, on any computer, with nobody looking.