IntelliJ IDEA
Find your way around IntelliJ IDEA 2026.2, from a project's folders to running a Java program and stepping through it with the debugger.
Novice · Software Development · Java · Updated
After this lesson you can
- Find your code in IntelliJ IDEA's Project tool window, run it, and read the result in the Run tool window
- Pause a Java program at a breakpoint and step through it with IntelliJ IDEA's debugger
Key takeaways
- IntelliJ IDEA, made by JetBrains, is the IDE for your Java work. Its free features cover everything in this course.
- The Project tool window shows your project's folders. Your Java source files go in the src folder.
- The green Run arrow builds and starts your program, and the Run tool window shows what it prints. Exit code 0 means it finished without an error.
- A breakpoint pauses a Debug run before its line runs. Step Over (F8) then runs one line at a time while you watch the variables.
IntelliJ IDEA, made by JetBrains, is the IDE you'll use for all your Java work. You installed it in the Setup exercises of OS and Terminal Tools. Like every IDE, it has hundreds of menus, but you only need a few parts of it to start: where your files live, how to run your program, and how to watch it run, one line at a time.
IntelliJ IDEA is one product. Its core features are free, and they cover everything in this course; a paid subscription adds more tools. Until version 2025.2 it came in two editions, a free Community Edition and a paid Ultimate Edition, so you may still see those names online. This course uses IntelliJ IDEA 2026.2 with Java 25.
Projects and the Project tool window
IntelliJ IDEA keeps each program in a project: a folder with your code and IntelliJ IDEA's settings for it. Here is the setup-check project you made during setup:
setup-check/        the project folder
├── .idea/          IntelliJ IDEA's settings for this project
└── src/            your Java code
    └── Main.java   a source file
src(short for source) holds your source files: the.javafiles you write..ideaholds IntelliJ IDEA's settings for the project, such as which JDK it uses. You don't need to open it.
Next to them you'll find a file or two IntelliJ IDEA made for itself, such as setup-check.iml. Leave them alone. New projects go in a folder named IdeaProjects in your home folder, unless you choose another place.
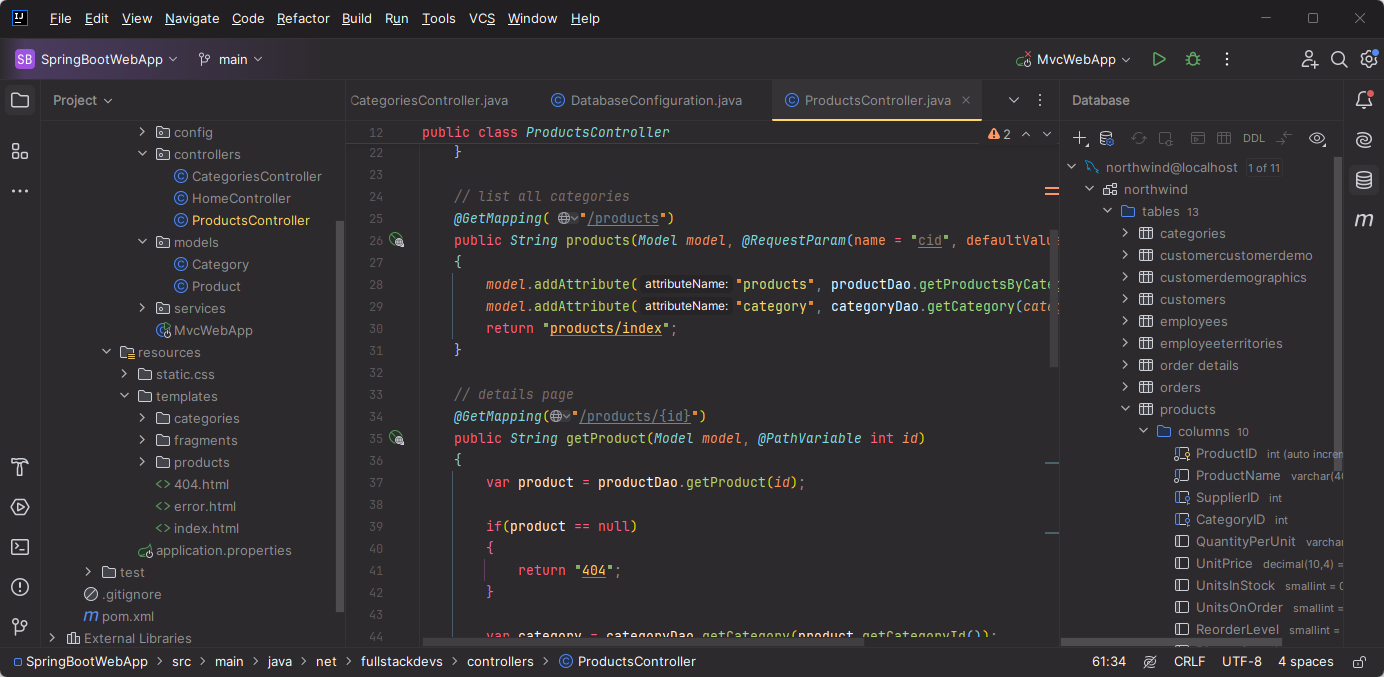
The Project tool window, on the left, shows your project as a tree. Double-click a file to open it in the editor. If the Project tool window has disappeared, click the folder icon at the top of the window's left edge, or press Alt+1 (Cmd+1 on a Mac).
Later projects in the course use Maven, a tool that builds Java projects. They add a pom.xml file and keep the code a few folders deeper inside src. You'll meet Maven in the Java Maven Project lesson.
Running your program
Open Main.java. In the margin to the left of your code, called the gutter, there's a green arrow beside the line with main. Click it and choose Run.
IntelliJ IDEA first builds your program: it compiles your source files with the JDK's compiler. Then it starts the program, and the Run tool window opens at the bottom with what the program printed, followed by:
Process finished with exit code 0
Exit code 0 means the program finished without an error. Any other number means something went wrong: read the red text above it.
After the first run, the green arrow at the top of the window runs the same program again. These keys do the same:
| To | Windows | Mac |
|---|---|---|
| Run the program | Shift+F10 | Ctrl+R |
| Run it with the debugger | Shift+F9 | Ctrl+D |
| Stop it | Ctrl+F2 | Cmd+F2 |
If your code has a mistake the compiler can find, the build fails. The Build tool window lists each error with its file and line, and the editor underlines it in red. Click an error to jump to its line.
The debugger
A program runs millions of lines a second, far too fast to watch. The debugger lets you pause it, look at every variable, and move forward one line at a time.
Try it. You need a program to debug, so make a quick project:
- Choose File > New > Project. (On Windows, the menus may be hidden behind the ☰ button at the top left.)
- Select Java on the left, set Name to
DebuggerTry, set Build system to IntelliJ, and choose the JDK that shows 25. Leave Add sample code checked, and click Create. - Open
Main.javain thesrcfolder, and replace everything in it with this program.
Don't worry about how the code works yet. int[] holds a list of scores, and the for loop visits each score in turn. You'll learn both in the Arrays and Loops chapter.
public class Main {
    public static void main(String[] args) {
        int[] scores = { 21, 14, 35, 28 };
        int total = 0;

        for (int score : scores) {
            total = total + score;
        }

        System.out.println("Total points: " + total);
    }
}
Total points: 98
Now step through it:
- Click the line number of the line
total = total + score;. A red dot appears: a breakpoint, a place where the program will pause. - Click the green arrow beside
mainand choose Debug. The program starts, and stops on the breakpoint's line before running it. IntelliJ IDEA highlights that line. - The Debug tool window opens at the bottom. Its Threads & Variables tab lists every variable and its value, and IntelliJ IDEA also shows the values in gray beside your code.
- Press F8 (Step Over) to run one line. Press F9 (Resume Program; Cmd+Option+R on a Mac) to run until the breakpoint is reached again. Each time the program pauses there,
totalhas grown: 0, then 21, 35 and 70. - Click the red dot to remove the breakpoint, then resume to let the program finish and print 98.
| Windows | Mac | Name | What it does |
|---|---|---|---|
| Ctrl+F8 | Cmd+F8 | Toggle Line Breakpoint | Adds or removes a breakpoint on the current line |
| F8 | F8 | Step Over | Runs the current line, then pauses on the next one |
| F7 | F7 | Step Into | Like Step Over, but goes inside a method the line calls |
| F9 | Cmd+Option+R | Resume Program | Runs until the next breakpoint, or to the end |
On a Mac laptop, hold fn to use the F keys.
A breakpoint only pauses a Debug run. Run (the green arrow's Run, or Shift+F10) ignores breakpoints and goes straight to the end.
When a program gives a wrong answer, the debugger is how you find out why: put a breakpoint where things should still be right, and step forward until a value isn't what you expect.
Check yourself
2 questions to try on the lesson page.
So what
IntelliJ IDEA does three jobs for you: it keeps your Java code organized in a project, it builds and runs your program with one click, and its debugger shows you what your program really does, line by line.