Developer Tools
Every browser has built-in developer tools that show any element on a page, its HTML and every CSS rule applied to it, so you can find out why a page looks the way it does.
Apprentice · HTML · CSS · Updated
After this lesson you can
- Use the browser's developer tools to find an element and the CSS rules applied to it
Key takeaways
- Every modern browser has built-in developer tools for seeing how a page is built and styled.
- Press F12, or right-click an element and choose Inspect, to open them.
- In Chrome and Edge, the Elements panel shows the page's HTML, and the Styles pane shows every CSS rule applied to the element you chose.
- A crossed-out line in the Styles pane is a style that isn't being used, usually because another rule overrode it.
- A change you make in the developer tools lasts only until you reload the page.
Styling your pages can be both a frustrating and a rewarding task. Often when you try to style a page things just don't look the way you want them to, and you need to debug your styles.
All modern browsers have built-in developer tools which allow you to see the details of a page and how CSS rules and formatting are applied. You should become familiar with the Developer Tools and use them frequently as you design your pages. They also provide robust debugging tools for JavaScript, which you will see later in the course.
To open the Developer Tools you can press the F12 key (on a Mac, Cmd+Option+I), or you can right-click on an element and select Inspect.
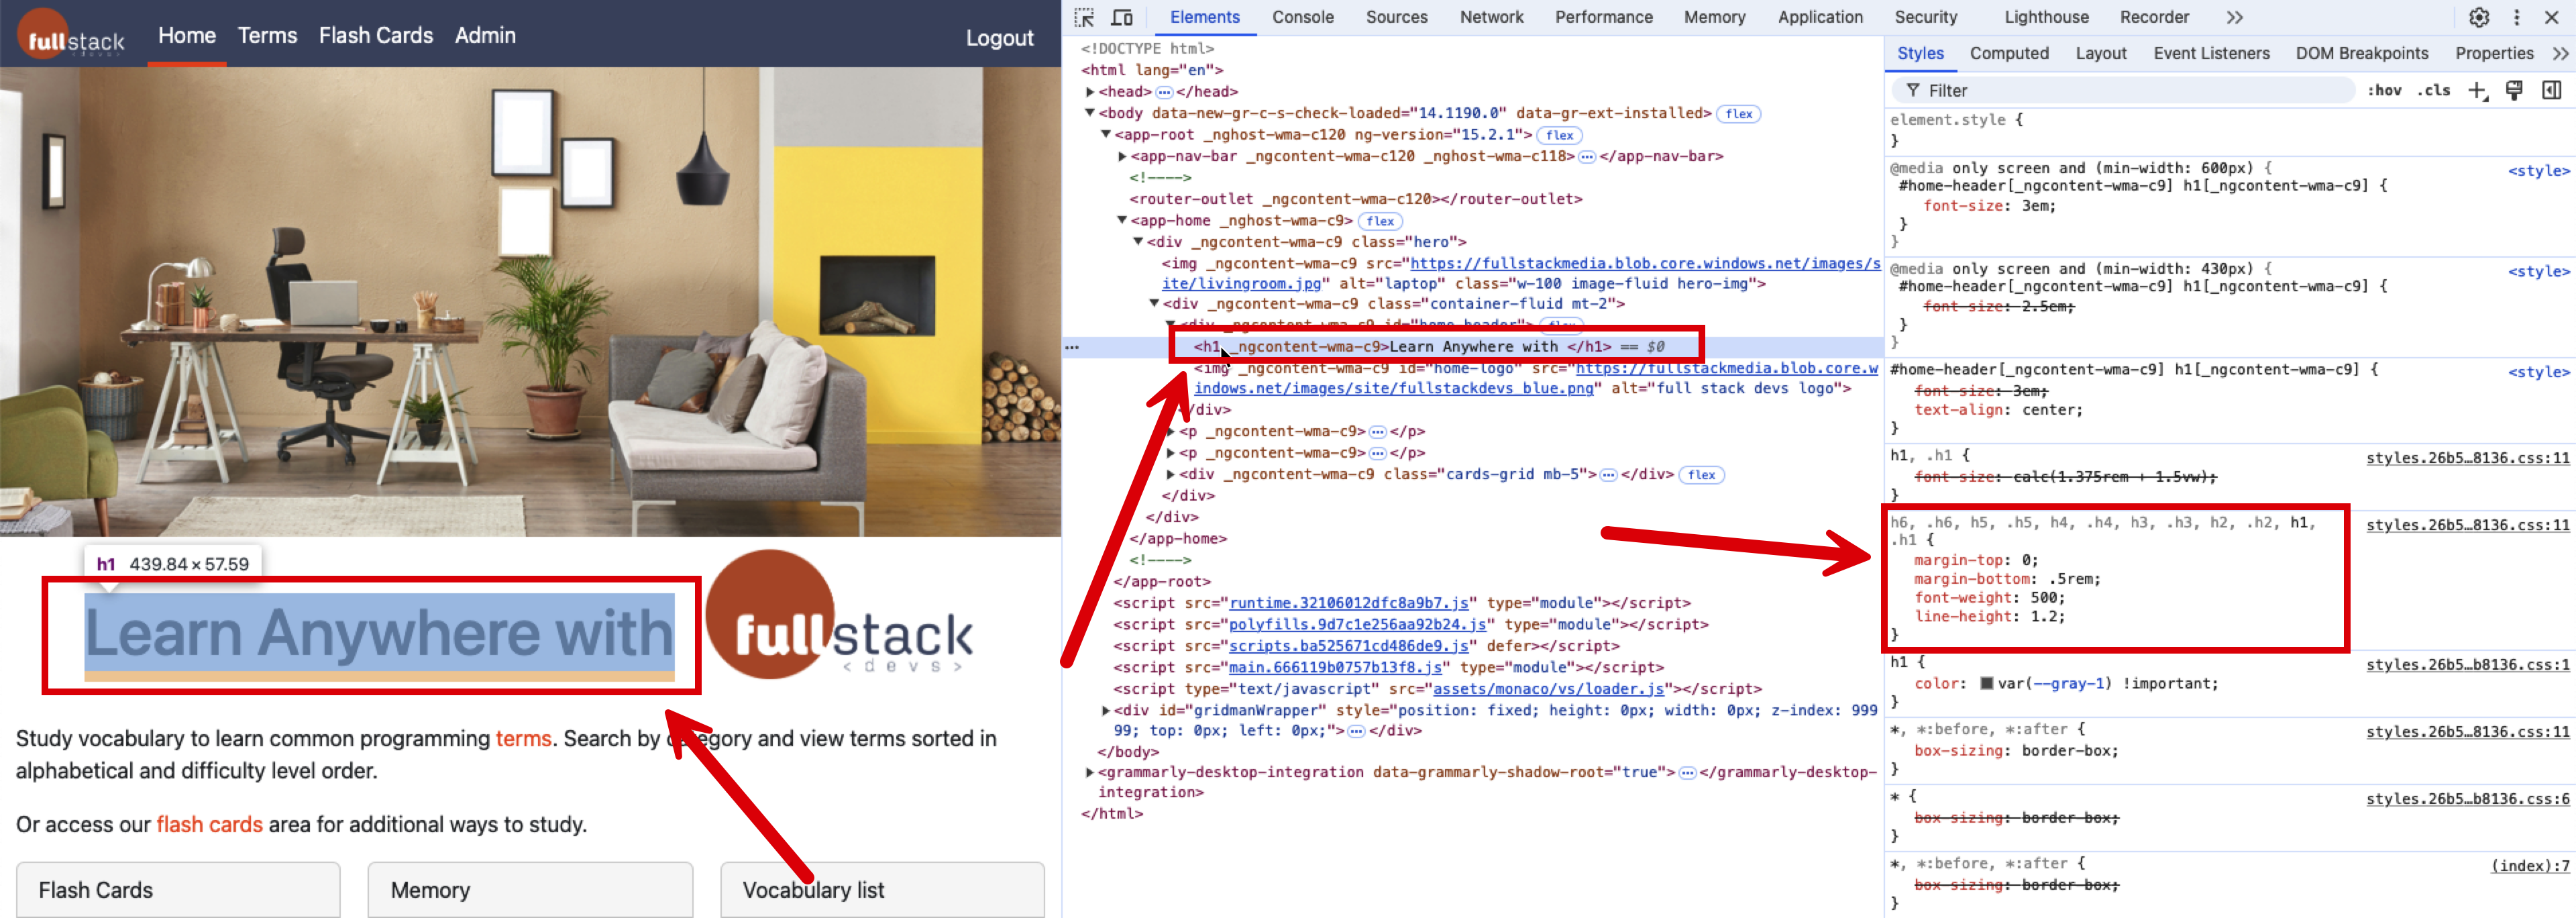
With the developer tools you can highlight specific elements and visually see which element on the page is being referenced. You can also see which CSS styles are applied to that element.
Inspect an element
The Elements panel shows the page's HTML. Point at a line there and the browser highlights that element on the page; click it and the Styles pane beside it lists every CSS rule that applies to it, with the file each rule came from. These are the names in Chrome and Edge; in Firefox the same parts are called the Inspector and the Rules pane.
- A line that is crossed out is a style that isn't being used, usually because another rule overrode it.
- You can click a value in the Styles pane and change it, and the page changes at once. It's a quick way to try an idea, but the change is gone when you reload the page, so copy what works into your CSS file.
Try it. Open any page you like, right-click a heading and choose Inspect. Find the rule that sets its color in the Styles pane, change the color, and watch the heading change.
As you complete your exercises, you should form a habit of opening your developer tools and using them to help you understand your page layout and CSS.
Check yourself
2 questions to try on the lesson page.
So what
When a page doesn't look the way you expected, the developer tools show you what the browser is really doing, so you can stop guessing.