Filtering Rows with a Condition
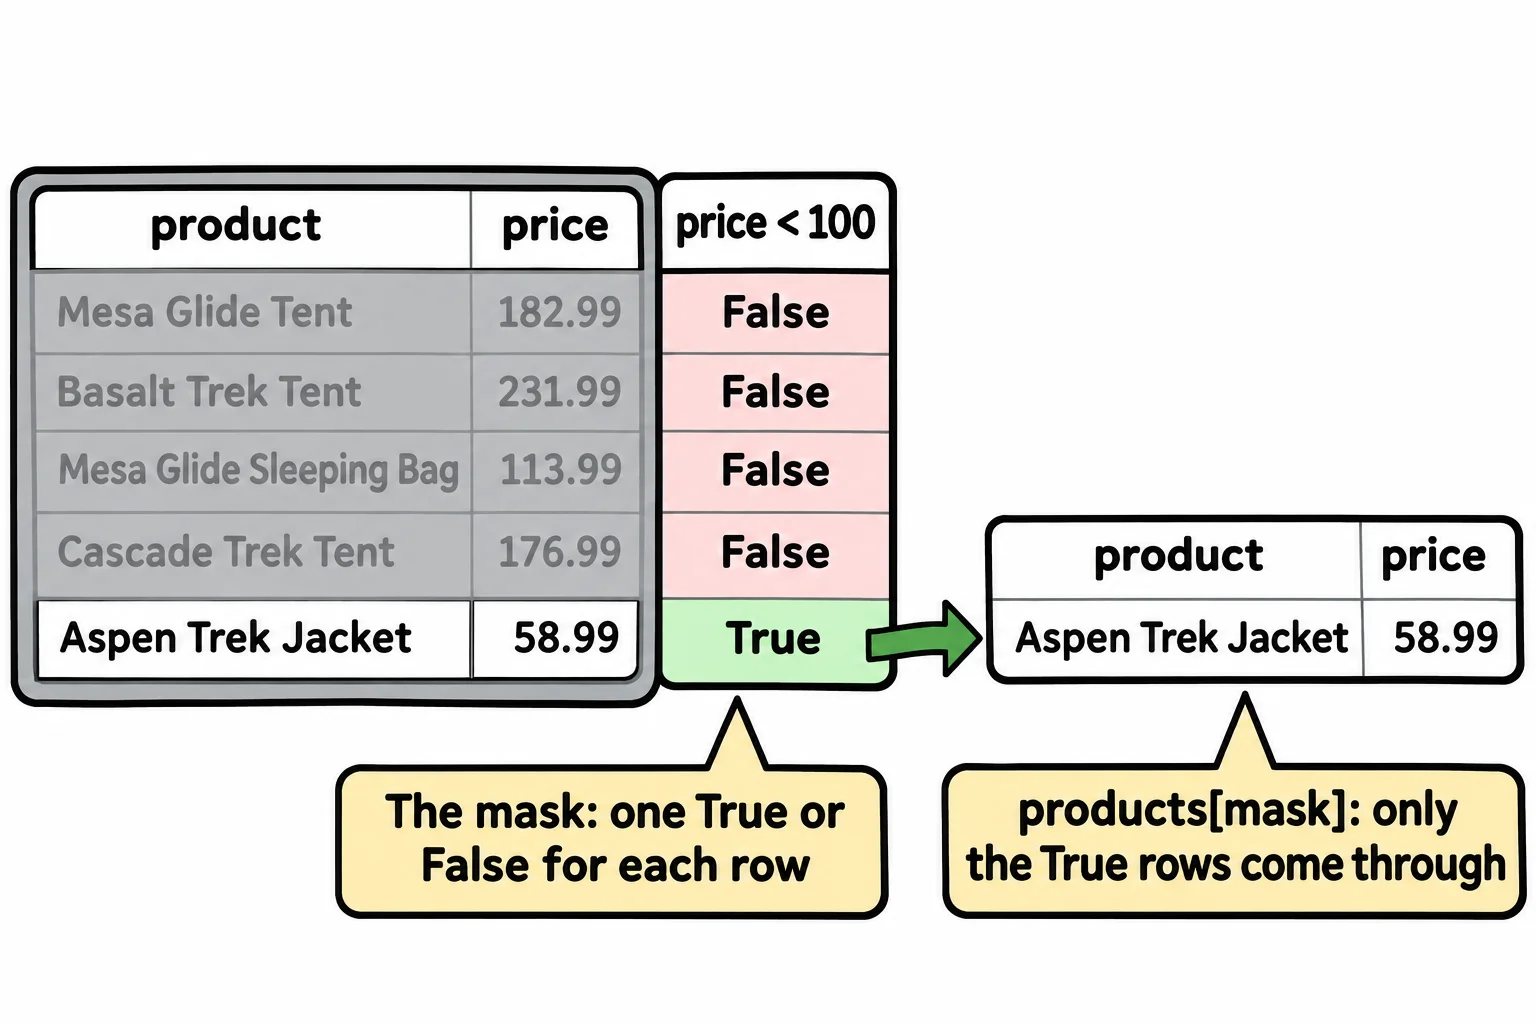
A comparison such as products["price"] < 100 gives a True or False answer for every row, called a mask; putting the mask in square brackets, products[mask], keeps only the rows where it is True; and sum() and mean() on the mask count the matching rows and give their share of the table.
Apprentice · Python · Updated
After this lesson you can
- Filter a DataFrame's rows with a condition, df[mask], and explain the True or False mask a comparison makes
- Count the rows that match a condition with sum, and find their share of the table with mean
Key takeaways
- A comparison on a column, such as products["price"] < 100, answers True or False for every row. That column of answers is called a mask.
- df[mask] keeps the rows where the mask is True. Read products[products["price"] < 100] as "the products where price is less than 100".
- A True or False column, such as on_sale, is already a mask, so products[products["on_sale"]] keeps the products on sale.
- mask.sum() counts the matching rows, because True counts as 1, and mask.mean() gives their share of the table.
Most questions about a table are about some of its rows: the orders over $100, the patients older than 65, the products that are out of stock, the readings taken on Mondays. Before you can count them, average them or chart them, you have to pick those rows out. A data job, a lab report and a machine learning project all start this way, and in pandas it takes one line.
The example is Trailhead Outfitters, an outdoor gear store, and its catalog, products.csv: 300 products, one row each. Its columns are sku (the store's product code, such as TO-1005), product, category (tents, backpacks, boots, jackets, stoves or sleeping bags), brand, price, stock (how many are on the shelf), rating, reviews, on_sale (True or False) and weight_oz. The catalog is our own made-up data.
A question about some of the rows
A shopper has $100 to spend. Which products can they buy? Here are the first five rows:
import pandas as pd

products = pd.read_csv("products.csv")
products[["sku", "product", "category", "price", "stock"]].head(5)
       sku                  product       category   price  stock
0  TO-1001          Mesa Glide Tent          tents  182.99     18
1  TO-1002         Basalt Trek Tent          tents  231.99     38
2  TO-1003  Mesa Glide Sleeping Bag  sleeping bags  113.99     10
3  TO-1004        Cascade Trek Tent          tents  176.99      8
4  TO-1005        Aspen Trek Jacket        jackets   58.99      0
VS Code draws the table as a grid; this lesson shows it as pandas prints it as text. Reading 300 prices by eye would take a while and miss some. A for loop with an if would work, but it's several lines for every question, and the questions keep coming.
A comparison makes a mask
Ask the whole column one question. A comparison with < (read "is less than") on a column doesn't give one answer; it gives one answer per row:
under_100 = products["price"] < 100
under_100.head(5)
0    False
1    False
2    False
3    False
4     True
Name: price, dtype: bool
Row 4, the $58.99 jacket, is the first True. A column of True and False answers like this is called a mask, or a boolean mask in your textbook (a boolean is a True or False value). Think of a stencil laid over the table: the True rows show through the holes, and the False rows stay covered.
Every comparison makes one: > (greater than), >= (greater than or equal to), <=, == (read "is equal to") and != ("is not equal to").
Keeping the rows: df[mask]
Put the mask inside the table's square brackets, and pandas keeps the rows where it's True:
products[products["price"] < 100][["sku", "product", "price"]].head(4)
       sku             product  price
4  TO-1005   Aspen Trek Jacket  58.99
5  TO-1006    Alpine Pro Boots  67.99
7  TO-1008   Willow Trek Stove  90.00
9  TO-1010  Canyon Glide Boots  79.99
Read products[products["price"] < 100] aloud as "the products where price is less than 100". The rows keep their index labels, 4, 5, 7 and 9, so the gaps show where the rows that didn't match were. The result is a new, smaller table; products itself still has all 300 rows.
The same pattern answers other questions. Text is compared in quotes, and a column that already holds True and False, like on_sale, is a mask as it is:
stoves = products[products["category"] == "stoves"]
sold_out = products[products["stock"] == 0]
on_sale = products[products["on_sale"]]
print("stoves:", len(stoves))
print("sold out:", len(sold_out))
print("on sale:", len(on_sale))
stoves: 36
sold out: 26
on sale: 72
A comparison needs two equals signs. With one, products[products["category"] = "stoves"], Python stops before anything runs: SyntaxError: cannot assign to subscript here. Maybe you meant '==' instead of '='?
To keep the matching rows and pick columns, use .loc, which picks rows and columns by their labels: the mask goes before the comma and the columns after it: products.loc[products["stock"] == 0, ["sku", "product"]].
How many match, and what share
Python counts True as 1 and False as 0. So adding up a mask counts the rows that match, and its average is the share that match:
print("products under $100:", under_100.sum())
print("rows in the catalog:", len(products))
print("share under $100:", round(under_100.mean(), 2))
products under $100: 75
rows in the catalog: 300
share under $100: 0.25
Seventy-five products, a quarter of the catalog, fit the shopper's budget. Counting before you look at the rows is a good habit: a filter that matches 0 rows, or all 300, usually means the condition isn't the one you meant. Often there's a second condition too, such as under $100 and in stock: two masks can be joined into one, with & for "and".
Check yourself
2 questions to try on the lesson page.
So what
One comparison turns a question into a mask, df[mask] keeps the rows that answer it, and sum() and mean() tell you how many there are, which is how most answers in data work begin.