Grouping with groupby
groupby sorts a table's rows into groups that share a value, such as a neighborhood, works out one number for each group (a sum, a mean, a count) and hands back one row per group, which answers "which one sold the most?" in a line instead of a filter for every group.
Apprentice · Python · Updated
After this lesson you can
- Total, average or count a column for each group with groupby, and read the result as one row per group
- Tell count from size in a groupby result, and sort a groupby result largest first with sort_values
Key takeaways
- groupby("neighborhood") sorts the rows into one group for each neighborhood; the column after it in square brackets is the one to summarize.
- The pattern is split, apply, combine. Split the rows into groups, work out one number for each group, then combine those numbers into one result.
- sum(), mean() and count() work on each group the way they work on a whole column, and the result has one row per group, labeled by the group.
- count() counts the values that are there in the column you picked, and size() counts the rows, so a column with gaps gives two different answers.
- sort_values(ascending=False) puts the result largest first, which is how most questions want it.
"Which neighborhood orders the most?" "Which pizza size gets the best tips?" "How long does a delivery take in each part of town?" Almost every question a manager, a teacher or a client asks about a table is a question about groups: one answer for each store, each class, each month. You'll use the tool in this lesson in nearly every analysis you write, for a class project, a lab report or a job.
The example is Crust & Co. Pizza's delivery orders, orders.csv: one row for each order over 13 weeks of summer, 3,006 orders in all. Its columns are order_id, ordered_at (the date and time), neighborhood (Elm Park, Hillside, Lakeshore, Old Town or Westgate), size (small, medium, large or party), toppings (how many), total (what the customer paid, in dollars), delivery_minutes, driver (a first name) and tip (blank when a cash tip wasn't recorded). The orders are our own made-up data.
One total per neighborhood, the long way
Load the orders in a notebook cell and look at a few columns:
import pandas as pd

orders = pd.read_csv("orders.csv")
orders[["order_id", "neighborhood", "size", "total", "tip"]].head()
   order_id neighborhood    size  total   tip
0     50001     Westgate   large  29.47  5.30
1     50002     Hillside   large  23.98  3.60
2     50003     Old Town  medium  20.98  3.78
3     50004    Lakeshore   small  26.76  2.68
4     50005     Hillside   small  16.48  3.30
VS Code draws the table as a grid; this lesson shows it as pandas prints it as text. The owner wants the sales for each neighborhood. One way is to keep only one neighborhood's rows and add up their totals. orders[orders["neighborhood"] == "Elm Park"] reads "the rows of orders where the neighborhood is Elm Park":
elm_park = orders[orders["neighborhood"] == "Elm Park"]
print("Elm Park:", round(elm_park["total"].sum(), 2))
Elm Park: 20383.6
That's one neighborhood. Four more means four more copies of the same two lines, each with a name to type correctly, and a sixth neighborhood next year means editing the code again. The work is the same every time, so pandas does it for you.
groupby: split, apply, combine
Think of a pile of paper receipts. You'd sort them into one pile per neighborhood, add up each pile, and write the five totals on one sheet. That's the whole idea, and it has a name: split, apply, combine. Split the rows into groups, apply a calculation to each group, combine the answers into one result.
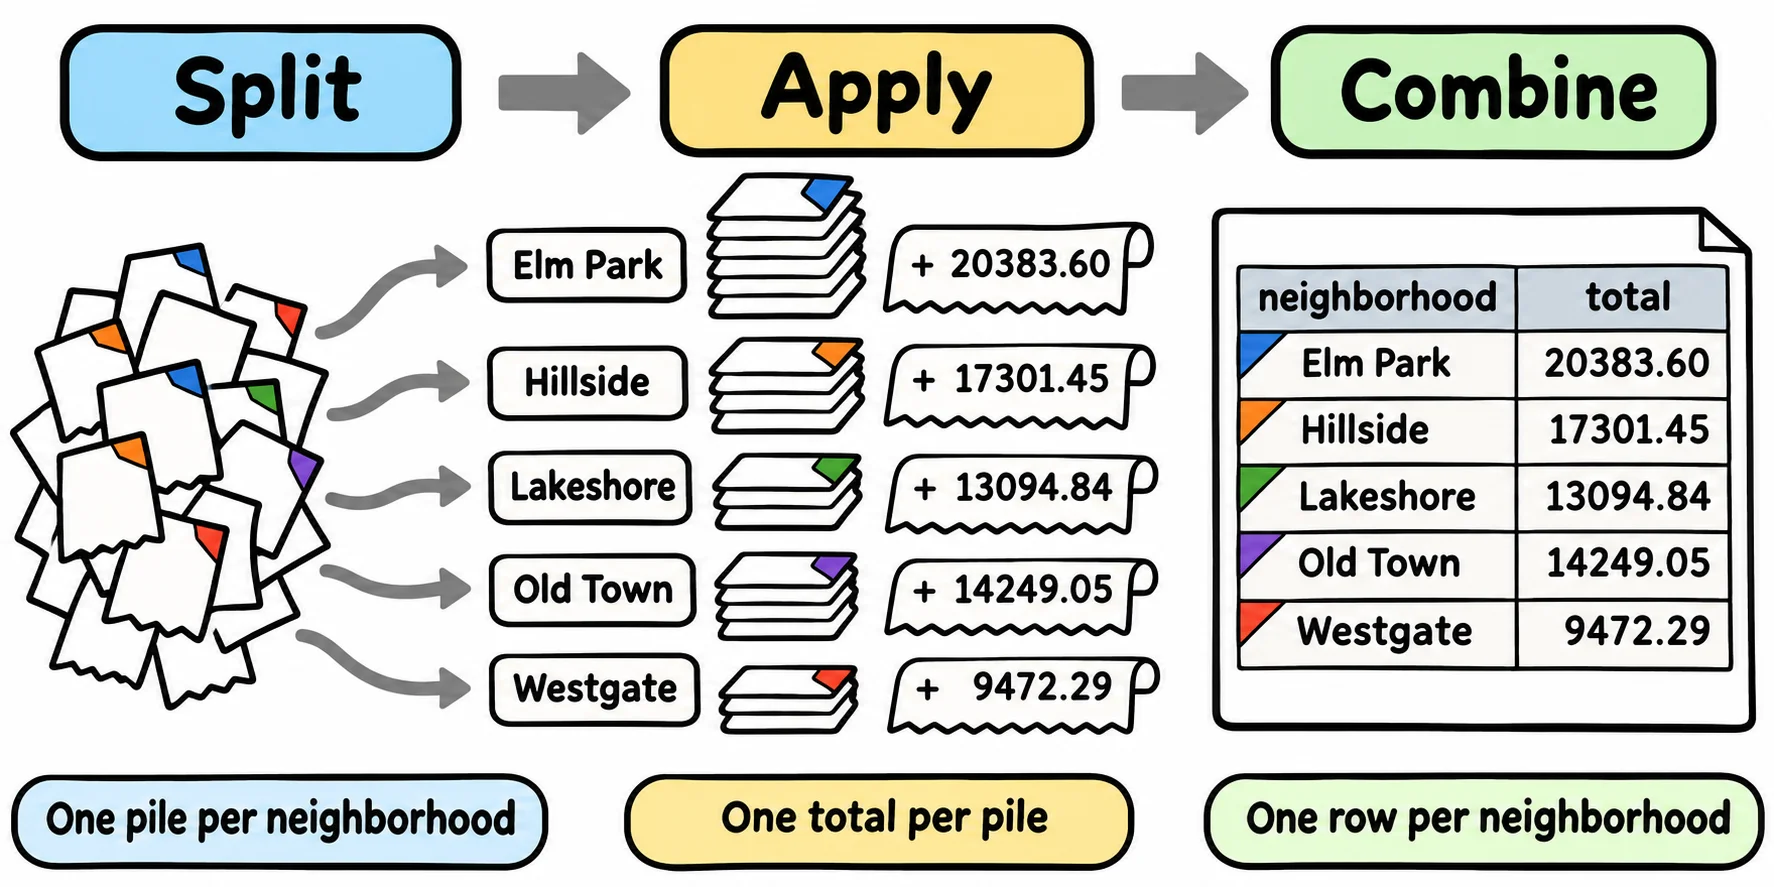
In pandas it's one line:
orders.groupby("neighborhood")["total"].sum()
neighborhood
Elm Park     20383.60
Hillside     17301.45
Lakeshore    13094.84
Old Town     14249.05
Westgate      9472.29
Name: total, dtype: float64
Read it left to right: "group the orders by neighborhood, take the total column, and sum each group". groupby("neighborhood") does the splitting, ["total"] picks the column to work on, and sum() is the calculation. The result has one row per neighborhood, labeled by the neighborhood's name, in alphabetical order. Elm Park's 20383.60 matches the long way, and a sixth neighborhood would get its own row with no change to the code.
If you've written SQL, this is SQL's GROUP BY: one result row for each value of the grouping column.
Other summaries: mean, count and size
Any summary that works on a whole column works on each group. The average delivery time per neighborhood is mean(), rounded to one decimal place so it reads well:
orders.groupby("neighborhood")["delivery_minutes"].mean().round(1)
neighborhood
Elm Park     24.2
Hillside     28.0
Lakeshore    30.2
Old Town     20.2
Westgate     36.2
Name: delivery_minutes, dtype: float64
Westgate, the farthest neighborhood, waits about 16 minutes longer than Old Town.
Counting needs care, because pandas has two counts. size() counts the rows in each group, which is the number of orders:
orders.groupby("neighborhood").size()
neighborhood
Elm Park     817
Hillside     684
Lakeshore    524
Old Town     572
Westgate     409
dtype: int64
count() counts the values that are there in the column you picked, and leaves out the missing ones. The tip column is blank when a driver didn't record a cash tip:
orders.groupby("neighborhood")["tip"].count()
neighborhood
Elm Park     738
Hillside     628
Lakeshore    477
Old Town     527
Westgate     383
Name: tip, dtype: int64
Elm Park had 817 orders but only 738 recorded tips. Use size() for "how many orders", and count() for "how many orders have a value in this column".
Sorting the result
Questions usually want the biggest first. A groupby result is a column of numbers with labels, so sort_values(ascending=False) sorts it, largest first:
orders.groupby("neighborhood")["total"].sum().sort_values(ascending=False)
neighborhood
Elm Park     20383.60
Hillside     17301.45
Old Town     14249.05
Lakeshore    13094.84
Westgate      9472.29
Name: total, dtype: float64
Old Town moved up past Lakeshore, and the answer to "which neighborhood orders the most?" is the first row: Elm Park. Each step in the line hands its result to the next, so you can read a long line one dot at a time.
Check yourself
2 questions to try on the lesson page.
So what
Most questions about a table are about its groups, and groupby answers them all the same way: split the rows into groups, work out one number for each, and read the result one row per group.