Values That Can't Be Right: Sentinels and Outliers
A stand-in such as -999 for "no reading" and a sensor that reads 152 °F in the sun both throw off an average, so replace turns stand-ins into NaN, describe and between find the values that can't be true, and a suspect column flags them before they're blanked, while real but unusual readings stay.
Apprentice · Python · Updated
After this lesson you can
- Turn sentinel values such as -999 into NaN with replace, and explain how they throw off a mean
- Find impossible values with describe and between, flag them in a suspect column, and tell a mistake from a real outlier
Key takeaways
- A sentinel value is a stand-in such as -999 that means "no reading". Left as a number it drags every average with it, so replace(-999, np.nan) turns it into NaN.
- describe() shows each column's smallest and largest values, which is where impossible values give themselves away.
- between(low, high) answers True for each value inside a range, both ends included, and False for a value outside it or a missing one.
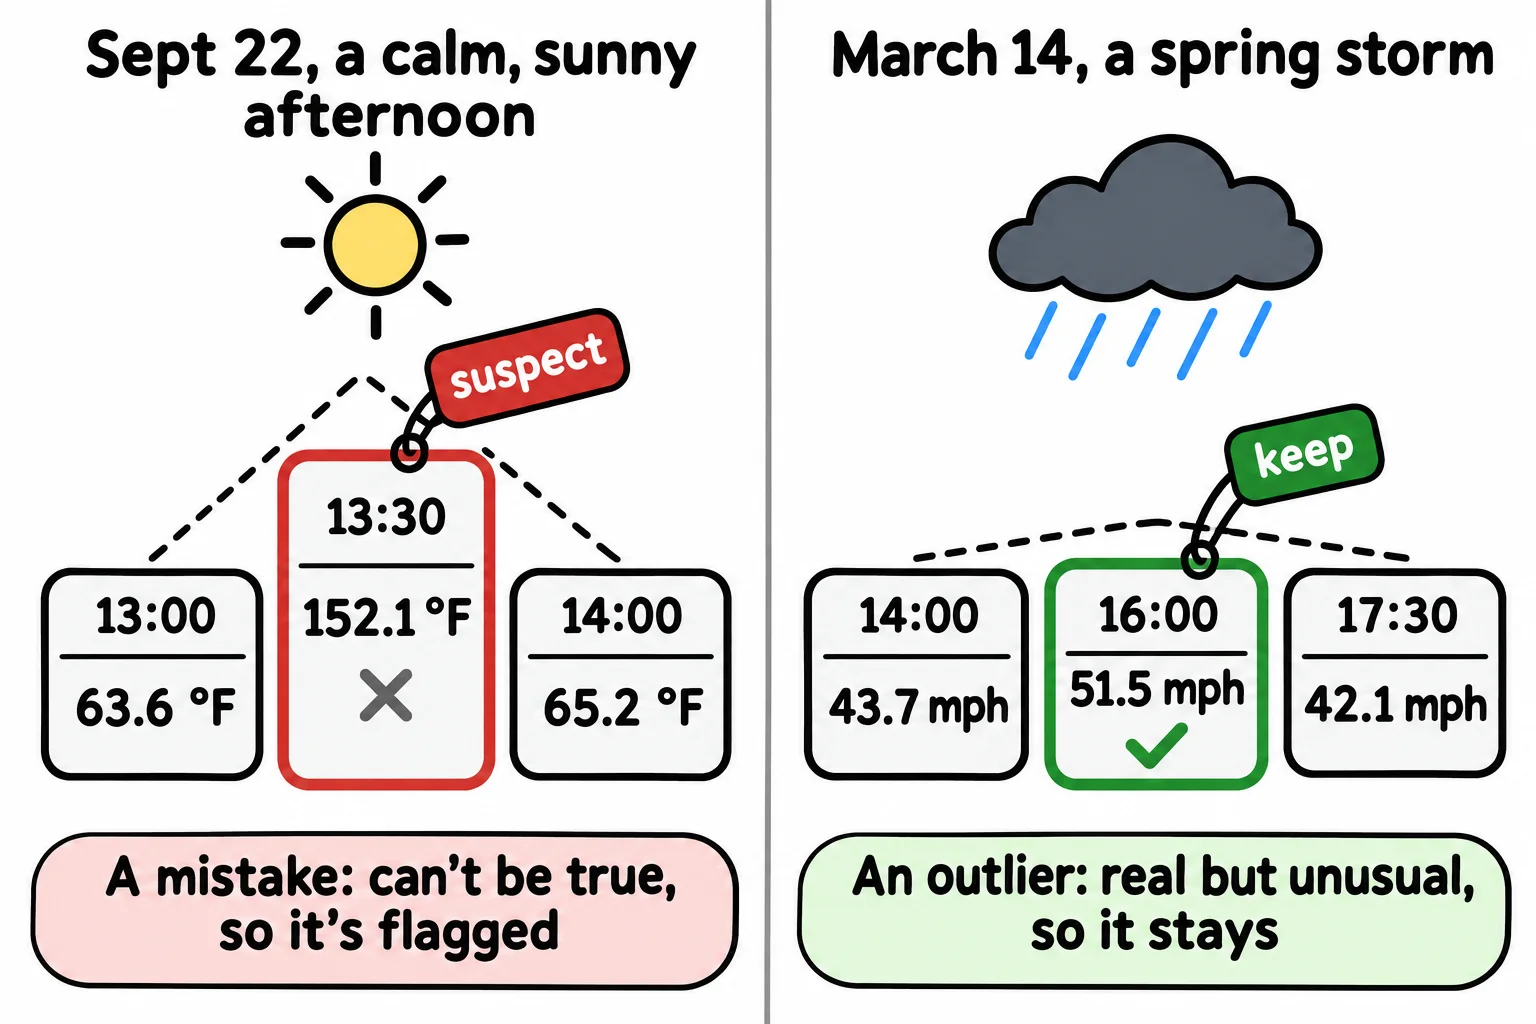
- An outlier is a real but unusual reading, such as a storm's 51.5 mph gust, and it stays. A mistake is a reading that can't be true, such as 152 °F on a calm afternoon.
- Flag a reading that can't be true in its own column before you blank it with mask, so the row's other readings stay and the change is on record.
Devices have their own ways of saying "I have nothing for you", and it's rarely an empty cell: a weather station writes -999, a fitness tracker writes 0 steps while it charges. pandas averages these like any other number. Before you report on data a device recorded, you check for them, along with readings that can't be true.
The example is the Ridgeview School weather station on the science building's roof: data/raw/readings.csv, a reading every 30 minutes for the 2025–26 school year. Its columns are timestamp, temp_f (degrees Fahrenheit), humidity_pct (how much water the air holds, as a percentage of the most it could hold), rain_in (inches in that half hour), wind_mph and battery_v (the station's battery, in volts). Our own made-up data.
An average that looks fine
import numpy as np
import pandas as pd

readings = pd.read_csv("data/raw/readings.csv")
print("average temperature:", round(readings["temp_f"].mean(), 1))
average temperature: 39.2
39.2 °F from September to June sounds believable. describe() shows why it isn't (VS Code draws the table as a grid; this lesson shows it as pandas prints it as text):
readings[["temp_f", "humidity_pct"]].describe().round(1)
        temp_f  humidity_pct
count  13344.0       13344.0
mean      39.2          63.0
std       72.0          73.8
min     -999.0        -999.0
25%       32.3          56.0
50%       42.7          67.0
75%       54.8          80.0
max      152.1         108.0
The roof never reached -999 °F.
Sentinels: a stand-in for "no reading"
Think of a sign-up sheet where someone wrote "TBD" for a phone number: it fills the space, but it isn't a phone number. A sentinel value is that idea in data, a value that stands in for "no reading here". This station writes -999 in temp_f and humidity_pct whenever that sensor drops out:
print("temperatures of -999:", (readings["temp_f"] == -999).sum())
print("humidities of -999:", (readings["humidity_pct"] == -999).sum())
temperatures of -999: 61
humidities of -999: 61
replace(-999, np.nan) swaps every -999 in the table for NaN (read "not a number"), pandas' mark for a missing value. np.nan is how NumPy writes it; NumPy is the package pandas is built on, installed with it and imported as np.
readings = readings.replace(-999, np.nan)
print("missing temperatures:", readings["temp_f"].isna().sum())
print("average temperature:", round(readings["temp_f"].mean(), 1))
missing temperatures: 61
average temperature: 43.9
Sixty-one stand-ins pulled the average down almost 5 degrees.
Can't be true, or only unusual?
describe() on the new table still shows a hottest reading of 152.1 °F and a humidity of 108%, and humidity can't pass 100%. between(low, high) asks each value "are you in this range?", both ends included:
in_range = readings["humidity_pct"].between(0, 100)
print("humidity readings:", readings["humidity_pct"].count())
print("between 0 and 100:", in_range.sum())
print("temperatures above 120:", (readings["temp_f"] > 120).sum())
humidity readings: 13283
between 0 and 100: 13218
temperatures above 120: 6
between says False for a missing value too, so compare it with count(), the values that are there: 65 humidities are above 100. The six hot readings all fall on calm early afternoons, and row 987's neighbors give the game away (.loc picks rows by their index, as Picking Rows and Columns: loc and iloc explains):
readings.loc[986:988, ["timestamp", "temp_f", "wind_mph"]]
            timestamp  temp_f  wind_mph
986  2025-09-22 13:00    63.6      11.8
987  2025-09-22 13:30   152.1       1.3
988  2025-09-22 14:00    65.2      10.1
Air doesn't warm 88 degrees in half an hour and cool off again; on a still, sunny afternoon the sun heated the sensor itself. That's a mistake, a reading that can't be true. The strongest winds are different (a condition in square brackets keeps the rows where it's True, as Filtering Rows with a Condition shows):
readings[readings["wind_mph"] > 42][["timestamp", "rain_in", "wind_mph"]]
             timestamp  rain_in  wind_mph
9324  2026-03-14 14:00     0.51      43.7
9328  2026-03-14 16:00     0.51      51.5
9331  2026-03-14 17:30     0.27      42.1
Hours of strong wind and heavy rain: a spring storm. The 51.5 mph gust is an outlier, a real reading far from the usual ones, and deleting it would erase the storm.
Flag first, then blank
A reading that can't be true shouldn't feed an average, but its row also holds real rain and wind readings. So first record which rows lose a value, in a True/False flag column, then blank the bad values:
temp = readings["temp_f"]
humidity = readings["humidity_pct"]
impossible_temp = (temp < -30) | (temp > 120)
impossible_humidity = (humidity < 0) | (humidity > 100)
readings["suspect"] = impossible_temp | impossible_humidity
print("suspect rows:", readings["suspect"].sum())
suspect rows: 71
| is read "or" (Combining Conditions with &, | and ~ covers it), and -30 °F to 120 °F is all the school's air could reach. A missing value isn't below or above anything, so it's never flagged. Then mask(condition) covers each value where the condition is True with NaN, like masking tape over a typo:
readings["temp_f"] = temp.mask(impossible_temp)
readings["humidity_pct"] = humidity.mask(impossible_humidity)
print("hottest reading:", readings["temp_f"].max())
print("rows:", len(readings))
hottest reading: 97.6
rows: 13344
Every row is still there, and 97.6 °F, September 10's heat wave, is real, so it stays. You'll also meet clip(lower, upper), which moves each value outside a range to its nearest end (108% becomes 100%). That writes in a number nobody measured, so save it for when the range's end is the true value.
Check yourself
2 questions to try on the lesson page.
So what
Stand-ins and impossible readings look like numbers until you check the smallest and largest values, so turn sentinels into NaN, flag what can't be true before you blank it, and keep the outliers that really happened.