# Reports: ConvertTo-Html and Out-GridView

ConvertTo-Html turns objects into a web page with a table, which a little CSS makes clear to read and anyone can open in a browser, and Out-GridView shows objects in a window you can filter, sort and click, where -PassThru sends the rows you pick on down the pipe.

Journeyman · PowerShell · Operating System · Updated November 10, 2026

## After this lesson you can

- Turn objects into a web-page report with ConvertTo-Html, with a heading and a little CSS
- Look through objects in a window with Out-GridView, and send the rows you pick down the pipe with -PassThru
- Choose between Export-Csv, ConvertTo-Json, ConvertTo-Html and Out-GridView for where the data goes next

## Key takeaways

- `ConvertTo-Html` turns objects into a web page with one table row each; `-PreContent` adds a heading above the table and `-Head` adds a title and a `<style>` block.
- CSS is the set of rules for how a page looks: borders, spacing and colors, written as `th { background: #2f9e44; }`.
- `Out-GridView` shows objects in a window you can filter and sort with the mouse. It's on Windows only.
- With `-PassThru`, the rows you pick in that window and send with OK go on down the pipe: the terminal and the mouse together.

Every month the owner of Maple Street Bikes wants to know how the rentals went: which bikes went out, and what they earned. A table in your terminal is the answer for you, but you can't email a terminal, and pasting it into an email loses the columns. People read reports in a browser or an inbox. This lesson turns the month's rentals into a web page anyone can open, then shows `Out-GridView`, a window where you look through rows and pick some with the mouse. An IT tech's weekly disk report and a shop's monthly sales page are made the same way. (The web page works everywhere; `Out-GridView` is **Windows only**.)

This lesson uses `rentals-2026-10-clean.csv`, the file you cleaned in *Saving Data: Export-Csv and Cleaning a CSV*. If you don't have it, this line makes it. Running it again is safe.

```powershell
Set-Content -Path "$HOME\terminal-practice\bike-shop\rentals-2026-10-clean.csv" -Value 'Date,Store,Bike,Hours,Fee', '2026-10-02,Downtown,City Bike,3,36', '2026-10-04,Riverside,E-Bike,2,50', '2026-10-09,Downtown,E-Bike,4,100', '2026-10-12,Riverside,City Bike,2,24', '2026-10-17,Downtown,Kids Bike,1,8', '2026-10-24,Riverside,E-Bike,6,150', '2026-10-30,Downtown,City Bike,5,60'
```

## A web page from objects: ConvertTo-Html

First the numbers: one pile per bike with Group-Object, three columns made with calculated properties, the biggest income first. The summary goes into a variable, `$summary`, as in *JSON: ConvertFrom-Json and ConvertTo-Json*, so the next steps can use it without building it again:

```powershell
Set-Location "$HOME\terminal-practice\bike-shop"
$summary = Import-Csv rentals-2026-10-clean.csv |
    Group-Object Bike |
    Select-Object @{ Name = 'Bike'; Expression = { $_.Name } },
        @{ Name = 'Rentals'; Expression = { $_.Count } },
        @{ Name = 'Income'; Expression = { ($_.Group | Measure-Object Fee -Sum).Sum } } |
    Sort-Object Income -Descending
$summary
```

```text
Bike      Rentals Income
----      ------- ------
E-Bike          3 300.00
City Bike       3 120.00
Kids Bike       1   8.00
```

Web pages are written in **HTML**, text with *tags* in angle brackets: `<table>` (read "table tag") starts a table, `<tr>` a table row, `<th>` a heading cell and `<td>` an ordinary cell. `ConvertTo-Html` writes it for you, one row per object. `-Title` names the browser tab, and `-PreContent` puts a heading above the table:

```powershell
$summary | ConvertTo-Html -Title 'October rentals' -PreContent '<h1>Maple Street Bikes: October rentals</h1>'
```

```text
<!DOCTYPE html PUBLIC "-//W3C//DTD XHTML 1.0 Strict//EN"  "http://www.w3.org/TR/xhtml1/DTD/xhtml1-strict.dtd">
<html xmlns="http://www.w3.org/1999/xhtml">
<head>
<title>October rentals</title>
</head><body>
<h1>Maple Street Bikes: October rentals</h1>
<table>
<colgroup><col/><col/><col/></colgroup>
<tr><th>Bike</th><th>Rentals</th><th>Income</th></tr>
<tr><td>E-Bike</td><td>3</td><td>300</td></tr>
<tr><td>City Bike</td><td>3</td><td>120</td></tr>
<tr><td>Kids Bike</td><td>1</td><td>8</td></tr>
</table>
</body></html>
```

You don't need to read HTML to use it. Find the three bikes in the `<td>` cells, and that's the report.

## A little CSS, then save and open it

A plain HTML table has no borders and no colors. **CSS** is the set of rules a browser uses to decide how a page looks, each one a thing to style, then its settings in curly braces: `th { background: #2f9e44; color: white; }` reads "heading cells get a green background and white text". A few rules go a long way. They go in a `<style>` block, which `-Head` puts at the top of the page. `-Head` replaces what `-Title` would write, so the title goes in it too:

```powershell
$head = '<title>October rentals</title><style> body { font-family: sans-serif; } table { border-collapse: collapse; } th, td { border: 1px solid #999; padding: 4px 12px; } th { background: #2f9e44; color: white; } </style>'
$summary | ConvertTo-Html -Head $head -PreContent '<h1>Maple Street Bikes: October rentals</h1>' | Set-Content rentals-report.html
Invoke-Item rentals-report.html
```

`Set-Content` saves the page as `rentals-report.html`, replacing it if it's there, and `Invoke-Item` opens it in your web browser. It's an ordinary file: email it, or put it in a shared folder, and anyone can open it with a double-click.
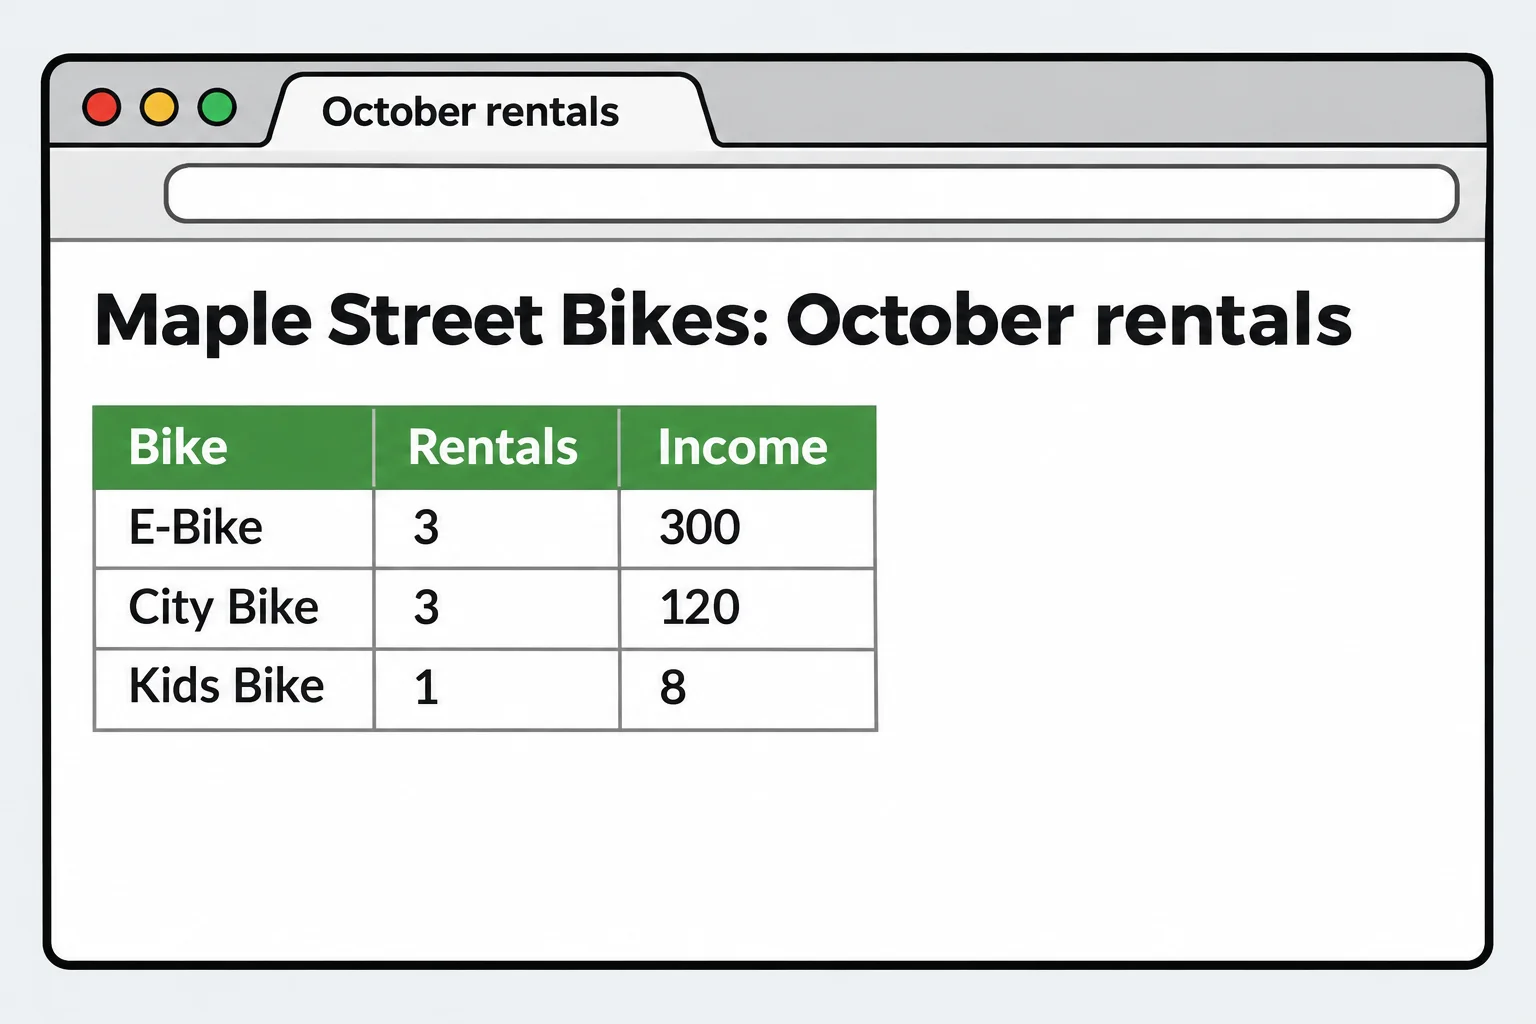
![The finished report in a web browser: the heading Maple Street Bikes: October rentals, then a table with green heading cells Bike, Rentals and Income and thin gray borders, and three rows: E-Bike 3 300, City Bike 3 120, Kids Bike 1 8](https://fsdtrainingmedia.blob.core.windows.net/public/images/2026/11/4c10fc8c2eb3415a93d27ecd095abcc9.webp)

## Look and pick: Out-GridView

Sometimes there's no rule for which rows you want: you'll know them when you see them. Say the owner wants to send a "how was your ride?" email after the longest e-bike rentals. `Out-GridView` shows objects in a window, where you type in the **Filter** box to narrow the rows and click a column heading to sort:

```powershell
Import-Csv rentals-2026-10-clean.csv | Out-GridView -Title 'October rentals'
```

![The Out-GridView window titled October rentals, with a Filter box at the top and the seven rentals in columns Date, Store, Bike, Hours and Fee](https://www.ask-codey.com/lessons/TODO)

With `-PassThru` the window gets **OK** and **Cancel** buttons, and PowerShell waits. Click the rows you want (hold **Ctrl** to pick more than one), click **OK**, and they go on down the pipe like any other objects. Here they're saved as a list for the emails:

```powershell
Import-Csv rentals-2026-10-clean.csv | Out-GridView -Title 'Pick the rentals to follow up' -PassThru | Export-Csv follow-up.csv
Get-Content follow-up.csv
```

With the two longest e-bike rentals picked, the file holds those two:

```text
"Date","Store","Bike","Hours","Fee"
"2026-10-09","Downtown","E-Bike","4","100"
"2026-10-24","Riverside","E-Bike","6","150"
```

That's the terminal and the mouse together, as *The Terminal and the Mouse: Two Ways In* promised: the command gathers the data, your eyes and a click choose, and the command carries on. **Cancel** sends nothing on.

`Out-GridView` is on **Windows only**, in PowerShell 7 and in Windows PowerShell 5.1. On a Mac or Linux the command isn't there; the `Microsoft.PowerShell.ConsoleGuiTools` module, from the PowerShell Gallery, adds `Out-ConsoleGridView`, which works the same way inside the terminal.

## Where is the data going?

You now have four ways to send data on. Pick by who, or what, reads it next:

| Where it's going | The command |
|---|---|
| Excel, or another program that reads tables | `Export-Csv` |
| An app's settings, or a website that wants JSON | `ConvertTo-Json` |
| A person, in a browser or an email | `ConvertTo-Html` |
| You, right now, to look through and pick from | `Out-GridView` |

**Try it.** Make a second report, `stores-report.html`, with one row per store: its rentals and income. Pick a color of your own for the heading cells.

## Check yourself

2 questions to try on the lesson page.

## So what

The data is the same whoever reads it; `ConvertTo-Html` makes it a page a person can open, and `Out-GridView -PassThru` lets your eyes choose while the pipeline does the rest.

## Key terms

- [ConvertTo-Html](https://www.ask-codey.com/glossary/convertto-html)
- [Out-GridView](https://www.ask-codey.com/glossary/out-gridview)
- [HTML](https://www.ask-codey.com/glossary/html-html)
- [CSS](https://www.ask-codey.com/glossary/css)

## Cheat sheets

- [Reports: ConvertTo-Html and Out-GridView](https://www.ask-codey.com/cheat-sheets/powershell-reports-cheat-sheet)

## Related

- [Saving Data: Export-Csv and Cleaning a CSV](https://www.ask-codey.com/lessons/powershell-export-csv)
- [JSON: ConvertFrom-Json and ConvertTo-Json](https://www.ask-codey.com/lessons/powershell-json)
- [The Terminal and the Mouse: Two Ways In](https://www.ask-codey.com/lessons/powershell-terminal-and-gui)
- [Columns You Make Yourself: Calculated Properties](https://www.ask-codey.com/lessons/powershell-calculated-properties)

Source: https://www.ask-codey.com/lessons/powershell-reports
