Is It Healthy? Memory, Load and Uptime
uptime says how long a computer has been running and how busy it is, which you compare with the number of CPUs nproc prints; free -h says how much memory is still available and df -h how much disk is left; and a short script puts them all on one screen.
Journeyman · Unix · Linux · Updated
After this lesson you can
- Read uptime's load average against the number of CPUs from nproc, and say whether a computer is busy
- Read free -h and df -h to say whether a computer is short of memory or disk space
- Write a script that shows a computer's uptime, load, memory, disk and failed services on one screen
Key takeaways
- uptime shows how long the computer has run and its load average: how many programs were running or waiting for a CPU over the last 1, 5 and 15 minutes.
- Compare the load with nproc, the number of CPUs. Below it, there's room; above it, programs wait their turn.
- In free -h, read available, not free: Linux lends spare memory to a cache and gives it back the moment a program needs it.
- df -h / shows how full the main disk is. A full disk stops logs, uploads and updates.
- A health check script puts uptime, load, memory, disk and failed services on one screen.
It's book club night, and members say the website is slow. Is the server struggling, or is it their Wi-Fi? Guessing wastes the evening, and a server has no screen to click around on. A car's dashboard answers "is it OK?" with a few gauges, and a computer has the same kind of gauges: how long it's been running, how busy it is, how much memory is left and how much disk. Four short commands read them. Administrators check these first on any slow server, and they're as useful on a laptop that suddenly crawls.
How long, and how busy: uptime
uptime
14:33:12 up 3:56, 1 user, load average: 0.49, 0.26, 0.27
From the left: the time now; up 3:56, running for 3 hours and 56 minutes since it last started; one user signed in; and three load numbers. A server that's been up for 200 days is normal. One that's been up for five minutes when nobody restarted it has come back from a crash or a power cut, so read its logs (Reading System Logs). In WSL, uptime counts from when WSL last started, not from when Windows did.
What load means
The load average is how many programs, on average, were running on a CPU or waiting for one, over the last 1, 5 and 15 minutes. Think of a grocery store's checkout lanes, with each CPU a lane. nproc counts the lanes:
nproc
24
This laptop has 24, so a load of 0.49 means nearly every lane is empty. The book club's small server might have 4. Compare the load with that number:
| Load on 4 CPUs | What it means |
|---|---|
| 1.0 | One lane busy, three free: plenty of room |
| 4.0 | Every lane busy, nobody waiting: full, but keeping up |
| 8.0 | Every lane busy and four programs waiting: things feel slow |
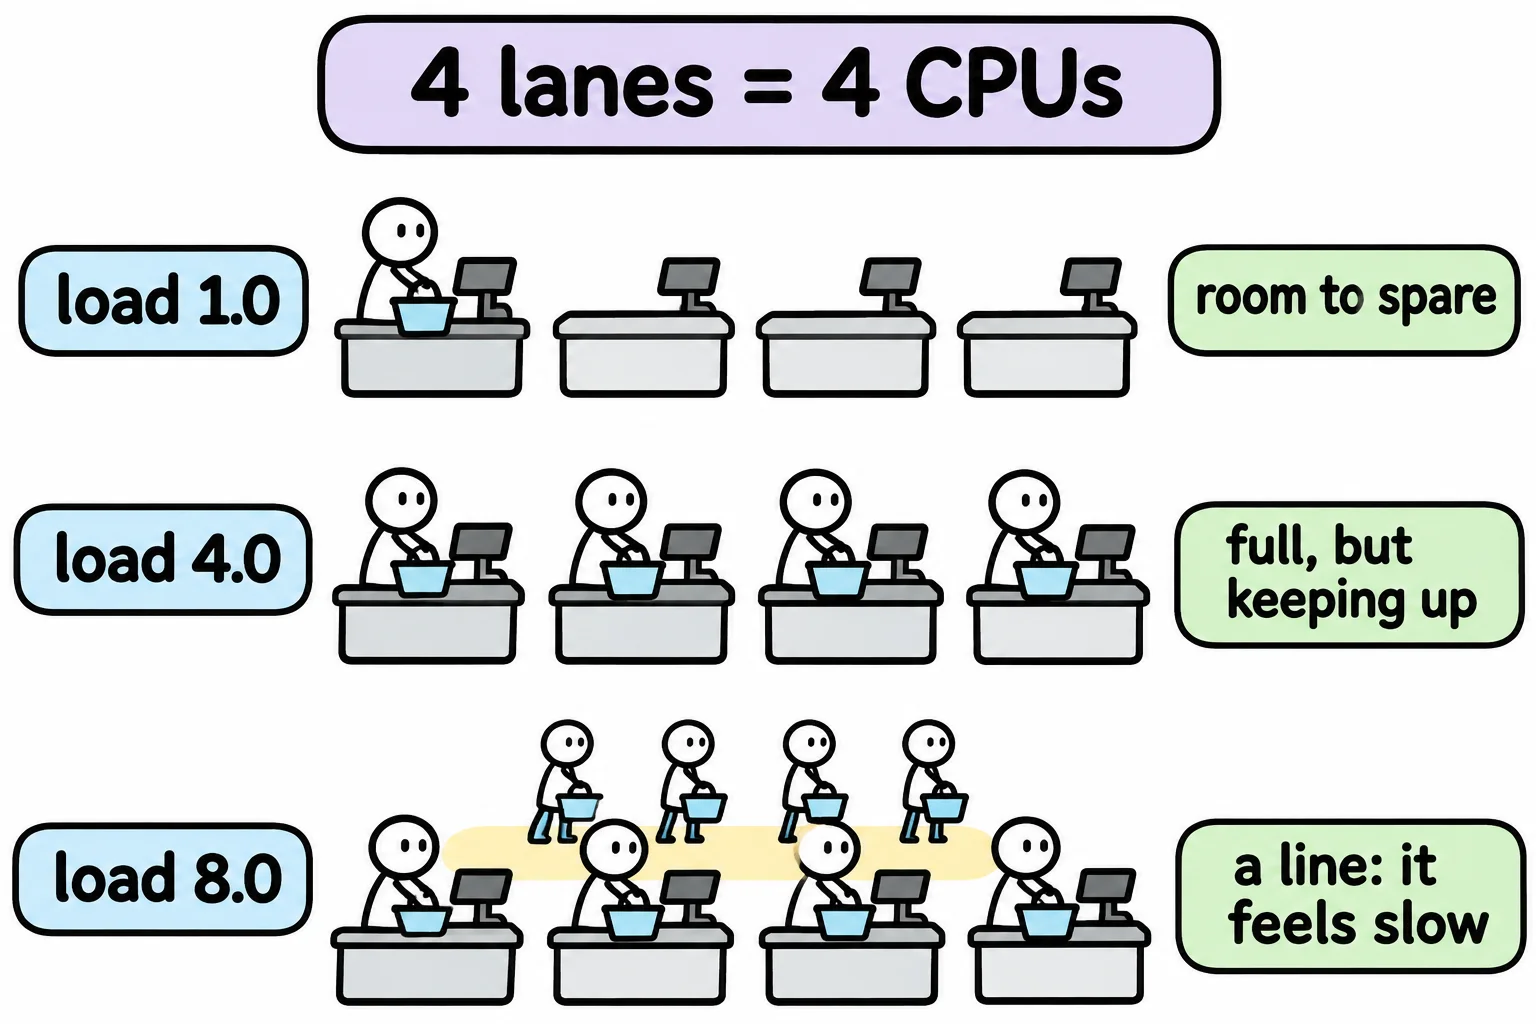
The three numbers show the trend: 6.0, 3.0, 1.0 is getting busier, and 1.0, 3.0, 6.0 is calming down. On a Mac, uptime prints the same three numbers, worded a little differently, and sysctl -n hw.ncpu counts the CPUs in place of nproc.
Memory and disk: free -h and df -h
free -h
               total        used        free      shared  buff/cache   available
Mem:            62Gi       1.9Gi        59Gi        43Mi       2.1Gi        60Gi
Swap:           16Gi          0B        16Gi
-h gives sizes people can read (Gi is near enough a gigabyte). The column to read is available: the memory programs can still get. Linux doesn't leave memory idle; it lends what's spare to a cache of recently used files (buff/cache) and gives it back the moment a program needs it, so a small free number is normal, and a small available number is the warning. Swap is disk space used as overflow memory, far slower than the real thing; swap that keeps filling up means too little memory. In WSL, free shows WSL's share of the Windows computer's memory. A Mac has no free: Activity Monitor's Memory tab shows the same.
You met df in What's Filling My Disk? du and df. / is the main disk:
df -h /
Filesystem      Size  Used Avail Use% Mounted on
/dev/sdd       1007G   31G  926G   4% /
Use% is the one to watch. A full disk breaks things quietly: logs stop, uploads fail, updates stop halfway. Past 90%, find what's filling it with du. (On a Mac, that column is called Capacity.)
One screen: a health check script
Four commands every time is a job for a script (A Script Is an Application). Make a practice folder and open a new script:
mkdir -p ~/terminal-practice/health && cd ~/terminal-practice/health
nano health.sh
Type this, save, and exit:
#!/usr/bin/env bash
# health.sh: how this computer is doing, on one screen.
echo "Health check, $(date '+%F %H:%M')"
echo "Uptime:  $(uptime -p)"
echo "Load:    $(uptime | awk -F'load average: ' '{print $2}') on $(nproc) CPUs"
echo "Memory:  $(free -h | awk '/^Mem:/ {print $7}') available of $(free -h | awk '/^Mem:/ {print $2}')"
echo "Disk:    $(df -h / | awk 'NR == 2 {print $5}') of / used, $(df -h / | awk 'NR == 2 {print $4}') left"
echo "Failed:  $(systemctl --failed --no-legend | wc -l) services"
chmod +x health.sh
./health.sh
Health check, 2026-11-09 14:33
Uptime:  up 3 hours, 56 minutes
Load:    0.45, 0.25, 0.26 on 24 CPUs
Memory:  60Gi available of 62Gi
Disk:    4% of / used, 926G left
Failed:  0 services
Each line is one command's answer, cut down with awk (Columns and Totals: awk): /^Mem:/ {print $7} is the seventh column of the Mem: line, NR == 2 is df's second line, and -F'load average: ' splits uptime's line at those words. uptime -p says the time up in words. systemctl --failed --no-legend lists failed services, one a line, and wc -l counts them. Your numbers will be your computer's own. This script is for Linux and WSL: a Mac has neither free nor systemctl.
Check yourself
2 questions to try on the lesson page.
So what
Uptime, load against the CPU count, available memory and disk space answer "is this computer OK?" in seconds, and a script that shows them all is one you'll keep on every server you look after.