Bar Charts: Comparing Categories
A bar chart draws one bar for each category with its height as the amount, so ax.bar compares groups such as flavors, sorting the table first puts the biggest bar first, ax.barh lays long names out sideways, and ax.bar_label writes each bar's number on it.
Apprentice · Python · Updated
After this lesson you can
- Draw a bar chart with ax.bar, sorted largest first, and use ax.barh when the category names are long
- Write each bar's value on it with ax.bar_label
Key takeaways
- A bar chart compares categories, such as flavors or stores, with one bar each; the bar's length is the amount.
- Sort the table before you draw it. Bars sorted largest first answer "which is biggest?" before anyone reads a label.
- ax.barh draws the bars sideways, which gives long category names room to read; for barh, sort smallest first so the biggest bar ends up on top.
- ax.bar_label writes each bar's value at its end, for the reader who needs the number as well as the comparison.
Which store sold the most, which product people return, which neighborhood uses the most water: whenever the question compares a few groups, the chart is a bar chart. It's the chart people read fastest, and the one you'll draw most often.
Hilltop Creamery's flavors.csv lists its 12 flavors in the order the menu board shows them, with the scoops of each sold in 2025. The owner is planning next year's order from the supplier and wants to know which flavors carry the shop.
Why a line won't do
Here's the table, in menu order:
import pandas as pd
import matplotlib.pyplot as plt

flavors = pd.read_csv("flavors.csv")
flavors
                  flavor  scoops_sold
0           Vanilla Bean         8573
1        Chocolate Fudge         7836
2             Strawberry         4383
3    Mint Chocolate Chip         6308
4           Cookie Dough         7018
5   Salted Caramel Swirl         6431
6           Butter Pecan         2521
7             Rocky Road         3757
8              Pistachio         2030
9   Coffee Toffee Crunch         4878
10       Black Raspberry         5342
11          Lemon Sorbet         3332
The months in Figures and Axes: How matplotlib Draws came in order, so a line between them meant something: the way from one month to the next. Flavors have no order. A line from Vanilla Bean down to Strawberry would suggest that something fell between them, and nothing did. Each flavor is a separate category, and a separate bar for each one says exactly that.
ax.bar, sorted largest first
ax.bar(x, height) takes the category names first and the bar heights second. Drawn in menu order, the bars go up and down like a skyline, and the reader has to compare every pair to find the best seller. Sort first, with the largest at the top of the table, and the bars come out largest on the left:
ranked = flavors.sort_values("scoops_sold", ascending=False)

fig, ax = plt.subplots()
ax.bar(ranked["flavor"], ranked["scoops_sold"])
ax.set_title("Scoops sold by flavor, 2025")
ax.set_xlabel("Flavor")
ax.set_ylabel("Scoops sold")
ax.tick_params(axis="x", labelrotation=90)
plt.show()
Now the answer to "which flavor sells most?" is the first bar, and the answer to "which sell least?" is the last. Unless the categories have an order of their own, such as small, medium and large, sort them by size.
Twelve names under twelve narrow bars run into each other, so the last line turns them: ax.tick_params(axis="x", labelrotation=90) turns the labels along the x-axis on their side, 90 degrees. That works, and the reader has to tilt their head to read them.
Long names: ax.barh
ax.barh draws the same bars sideways (the h is for horizontal), so each name sits on its own line at the left, level, with all the room it needs. The categories now run up the y-axis and the amounts along the x-axis, so the axis labels swap too.
One thing surprises everyone the first time: barh puts the first row at the bottom. To get the biggest bar on top, sort smallest first:
ranked = flavors.sort_values("scoops_sold")

fig, ax = plt.subplots()
bars = ax.barh(ranked["flavor"], ranked["scoops_sold"])
ax.set_title("Scoops sold by flavor, 2025")
ax.set_xlabel("Scoops sold")
ax.set_ylabel("Flavor")
ax.bar_label(bars)
plt.show()
The numbers on the bars: ax.bar_label
A bar chart is for comparing, and the comparison is often enough: Vanilla Bean beats Pistachio by a lot. But the owner ordering from the supplier needs the numbers too. ax.barh (and ax.bar) hands back the bars it drew, and ax.bar_label(bars) writes each bar's value right past its end. That's why the cell keeps them in bars.
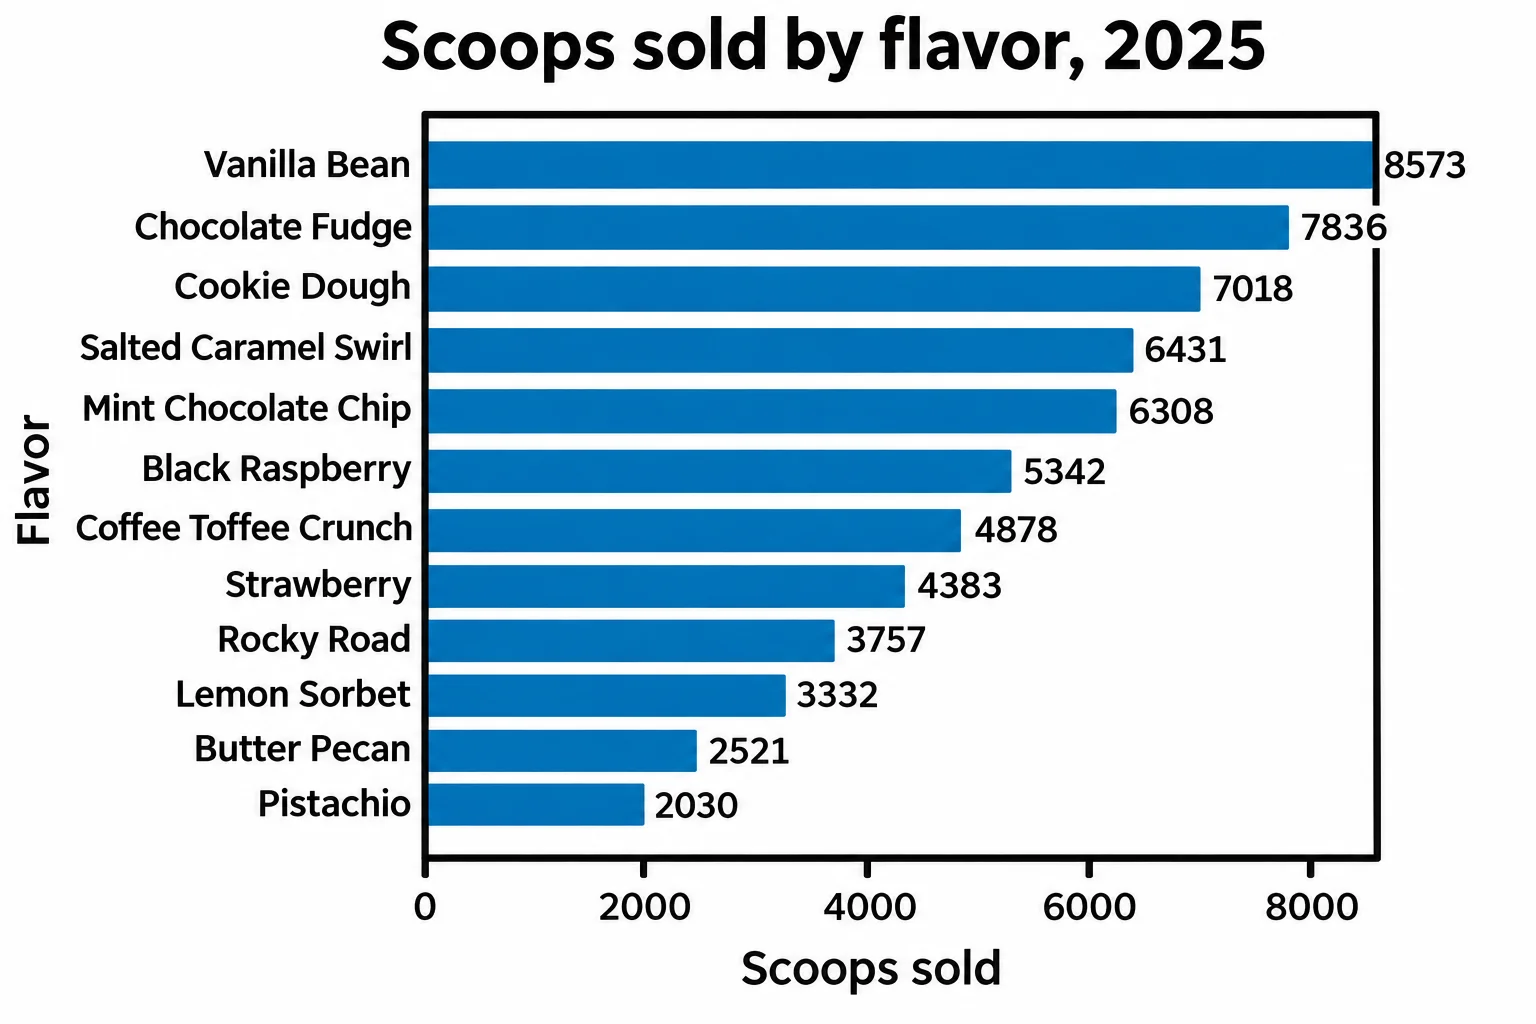
Read top to bottom, the chart is the supplier order: the four best sellers, Vanilla Bean, Chocolate Fudge, Cookie Dough and Salted Caramel Swirl, sold more than three times as many scoops as Pistachio.
Check yourself
2 questions to try on the lesson page.
So what
When the question compares groups, draw bars, sorted by size, sideways when the names are long, with the numbers on them when the reader needs them: the answer is the first bar.