Figures and Axes: How matplotlib Draws
matplotlib draws every chart on a Figure, the sheet of paper that gets saved, inside an Axes, the one chart on that sheet, so a chart starts with fig, ax = plt.subplots(), draws with ax.plot, is labeled with set_title, set_xlabel and set_ylabel, and is saved with fig.savefig.
Apprentice · Python · Updated
After this lesson you can
- Make a chart with fig, ax = plt.subplots() and ax.plot, and give it a title and axis labels
- Save a chart with fig.savefig, and explain why fig, ax is used instead of the plt.plot shortcut
Key takeaways
- A Figure is the whole image you save, like a sheet of paper, and an Axes is one chart drawn on it, with its data, its two axes and its title.
- fig, ax = plt.subplots() makes both at once and hands them back, so every later step says which chart it changes.
- ax.plot(x, y) takes the x values first and the y values second, and joins the points with a line in order.
- A chart without a title and axis labels shows numbers with no meaning, so set_title, set_xlabel and set_ylabel come with every chart.
- fig.savefig("name.png") writes the chart to an image file. The plt.plot shortcut works for a quick look, but fig, ax is what you change, save and test.
A chart is how an answer reaches someone who won't read a table: the graph in a lab report, the slide a manager looks at on Monday, the picture your class project needs on its first page. In Python, almost every one of those charts is drawn with matplotlib, and every matplotlib chart starts the same three lines. This lesson is those three lines, and what they mean.
The example is Hilltop Creamery, an ice cream shop, and daily.csv, one row for each day of 2025: the date, the day's high temperature in degrees Fahrenheit (high_temp_f), the cones_sold and whether it was rainy. The chapter's exercise makes the same file, so you can run every cell yourself.
Twelve numbers, one question
The owner wants to know when the busy season starts and ends, so she knows when to hire summer help. Grouping by month gives the answer as a table:
import pandas as pd
import matplotlib.pyplot as plt

daily = pd.read_csv("daily.csv", parse_dates=["date"])
monthly = daily.groupby(daily["date"].dt.month)["cones_sold"].sum()
monthly
date
1      535
2      700
3     1859
4     4057
5     5965
6     7409
7     7866
8     7597
9     5993
10    3884
11    1899
12     927
Name: cones_sold, dtype: int64
The answer is in there, but you have to read all twelve numbers and hold them in your head to see the shape: low, a steep climb, a peak, a fall. A chart shows that shape at a glance. The second import line brings it in: matplotlib.pyplot (read "pie plot") is the part of matplotlib that makes charts, and plt is the short name everyone gives it, as pd is for pandas.
A sheet of paper and a chart on it
Think of drawing a chart by hand. First you take a sheet of paper, then you draw a box on it with a line along the bottom and a line up the side, and put the points inside.
matplotlib has a name for each. The Figure is the sheet of paper: the whole image, the thing that gets saved. The Axes is one chart drawn on it: the box, its two axis lines, the data and the title. "Axes" sounds like more than one, but an Axes is a single chart, named after the two axes it has. One line makes both:
fig, ax = plt.subplots()
Read it "fig comma ax equals plt dot subplots". plt.subplots() makes a new Figure with one Axes on it and hands back the two of them, and Python puts the first in fig and the second in ax. (It's subplots because a Figure can hold several charts; a later lesson puts four on one page.)
Draw, then label
Everything you draw goes on ax. ax.plot(x, y) takes the values along the bottom first and the values up the side second, puts a point for each pair and joins them with a line, in order:
fig, ax = plt.subplots()
ax.plot(monthly.index, monthly.values)
ax.set_title("Cones sold each month, 2025")
ax.set_xlabel("Month")
ax.set_ylabel("Cones sold")
plt.show()
monthly.index holds the months, 1 to 12, so they run along the bottom (the x-axis), and monthly.values holds the cones, so they go up the side (the y-axis). Without the next three lines the reader would see a line and some numbers, and have to guess what any of them mean, so every chart gets them: set_title for the title over the chart, set_xlabel and set_ylabel for the words along each axis.
plt.show() says the chart is finished. In a notebook the chart appears under the cell, as a table does, and VS Code draws it as a picture. Without plt.show() the chart still appears, but the cell also prints the value its last line handed back, here Text(0, 0.5, 'Cones sold'), above it.
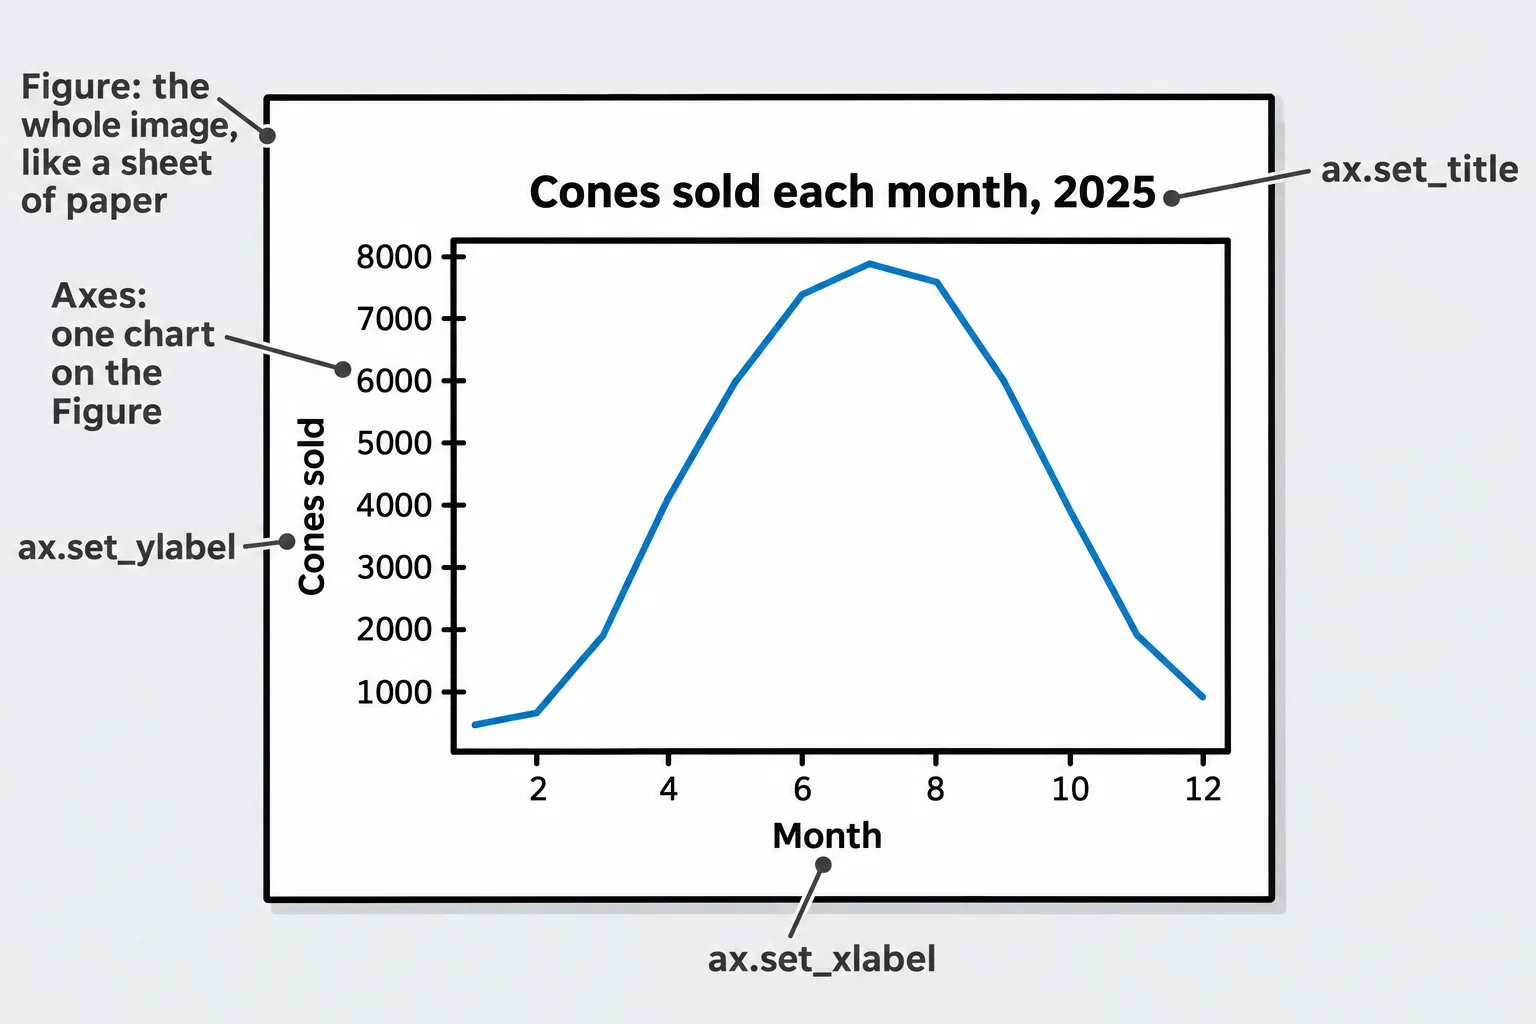
Now the shape is plain: the busy season runs from May to September, with July the peak.
Saving the chart, and why fig, ax
To put the chart in a report or an email, save it as an image file:
fig.savefig("cones-by-month.png")
fig.savefig writes the whole Figure to cones-by-month.png in the notebook's folder; the .png ending picks the PNG format. It's fig that saves, because the Figure is the sheet of paper.
Many answers you'll find online draw without fig and ax at all:
plt.plot(monthly.index, monthly.values)
plt.title("Cones sold each month, 2025")
plt.show()
This shortcut draws on whichever chart matplotlib thinks of as the current one. It's fine for a quick look. This course always uses fig, ax, because with them you know exactly which chart each line changes, you save the Figure you mean, and a function can hand them back, so a test can read the chart without looking at it:
ax.get_title()
'Cones sold each month, 2025'
That's how this chapter's exercise checks your charts: by reading their titles, labels and data from the Axes.
Check yourself
2 questions to try on the lesson page.
So what
Every matplotlib chart is a Figure with an Axes on it: make them with fig, ax = plt.subplots(), draw and label on ax, save with fig.savefig, and you can always say which chart you mean.