Charts Everyone Can Read
About one man in twelve can't tell red from green, so a chart never lets color carry the meaning alone, adding markers, line styles and labels on the lines, using a colorblind-friendly style such as tableau-colorblind10, keeping text big enough to read, and giving a chart in a report a sentence of alt text.
Journeyman · Python · Updated
After this lesson you can
- Tell lines apart with markers, line styles and labels, so color never carries the meaning alone
- Use a colorblind-friendly style, readable text sizes and a sentence of alt text for a chart in a report
Key takeaways
- About 1 in 12 men and 1 in 200 women can't tell some colors apart, most often red from green, and a chart printed in black and white loses its colors for everyone.
- Never let color alone tell the lines apart. Give each a different marker and line style, and write its name beside it.
- plt.style.use("tableau-colorblind10") switches every chart after it to colors chosen to stay different for most color-blind readers.
- A chart in a report gets a sentence of alt text that says what it shows, for a reader who can't see the picture.
The people who read your charts don't all see the same thing. Some can't tell red from green, some read your report printed in black and white, some read it on a phone in the sun, and some use a screen reader that can't see the picture at all. A chart that works for all of them is called accessible, and it's usually clearer for everyone else too. You'll need it for any chart that leaves your own screen: a report at work, a class poster, a public dashboard.
The example is Clearwater City's recycling log, pickups.csv: one row for each of six neighborhoods in each month of 2024 and 2025, with tons_recycled among its columns.
Red and green, and nothing else
Here are two neighborhoods' monthly recycling, told apart the way many charts do it, by color alone. pivot turns the table into one column per neighborhood, as Long to Wide with pivot shows:
import matplotlib.pyplot as plt
import pandas as pd

pickups = pd.read_csv("pickups.csv", parse_dates=["month"])
wide = pickups.pivot(index="month", columns="neighborhood", values="tons_recycled")

fig, ax = plt.subplots()
ax.plot(wide.index, wide["Downtown"], color="red", label="Downtown")
ax.plot(wide.index, wide["Riverside"], color="green", label="Riverside")
ax.set_title("Recycling in two neighborhoods")
ax.set_ylabel("Recycled (tons)")
ax.legend()
fig.autofmt_xdate()
plt.show()
To most readers, the red line and the green line are clearly different. But about 1 in 12 men and 1 in 200 women have color blindness of some kind, and the most common kind makes red and green look alike. For them, and for anyone with a black-and-white printout, these are two brownish lines and a legend that can't say which is which.
Never color alone: markers, line styles and labels
The rule is to give every line at least one more difference besides its color:
- a marker, the small shape drawn at each point:
marker="o"is a circle,"s"a square,"^"a triangle; - a line style:
linestyle="-"is solid,"--"dashed,":"dotted; - a label on the line itself, with
ax.text(x, y, "Downtown"), so the reader doesn't need to look across at a legend.
A colorblind-friendly style, and text you can read
matplotlib comes with styles: named sets of colors and sizes for every chart drawn after them. tableau-colorblind10 uses ten colors chosen to stay different for most color-blind readers. Set it once, near the top of the notebook, with the text size too:
plt.style.use("tableau-colorblind10")
plt.rcParams["font.size"] = 12
print(plt.rcParams["axes.prop_cycle"].by_key()["color"][:3])
['#006BA4', '#FF800E', '#ABABAB']
The first color is a deep blue and the second an orange, a pair that stays different for most people. plt.rcParams (read "r c params", matplotlib's settings) holds the default text size, 10 points; 12 reads better on a slide or a phone. Here's the chart again, with markers, line styles, the names on the lines and no colors set by hand:
fig, ax = plt.subplots()
ax.plot(wide.index, wide["Downtown"], marker="o", linestyle="-")
ax.plot(wide.index, wide["Riverside"], marker="s", linestyle="--")
ax.text(wide.index[-1], wide["Downtown"].iloc[-1], "  Downtown")
ax.text(wide.index[-1], wide["Riverside"].iloc[-1], "  Riverside")
ax.set_title("Downtown recycles more than Riverside every month")
ax.set_ylabel("Recycled (tons)")
fig.autofmt_xdate()
plt.show()
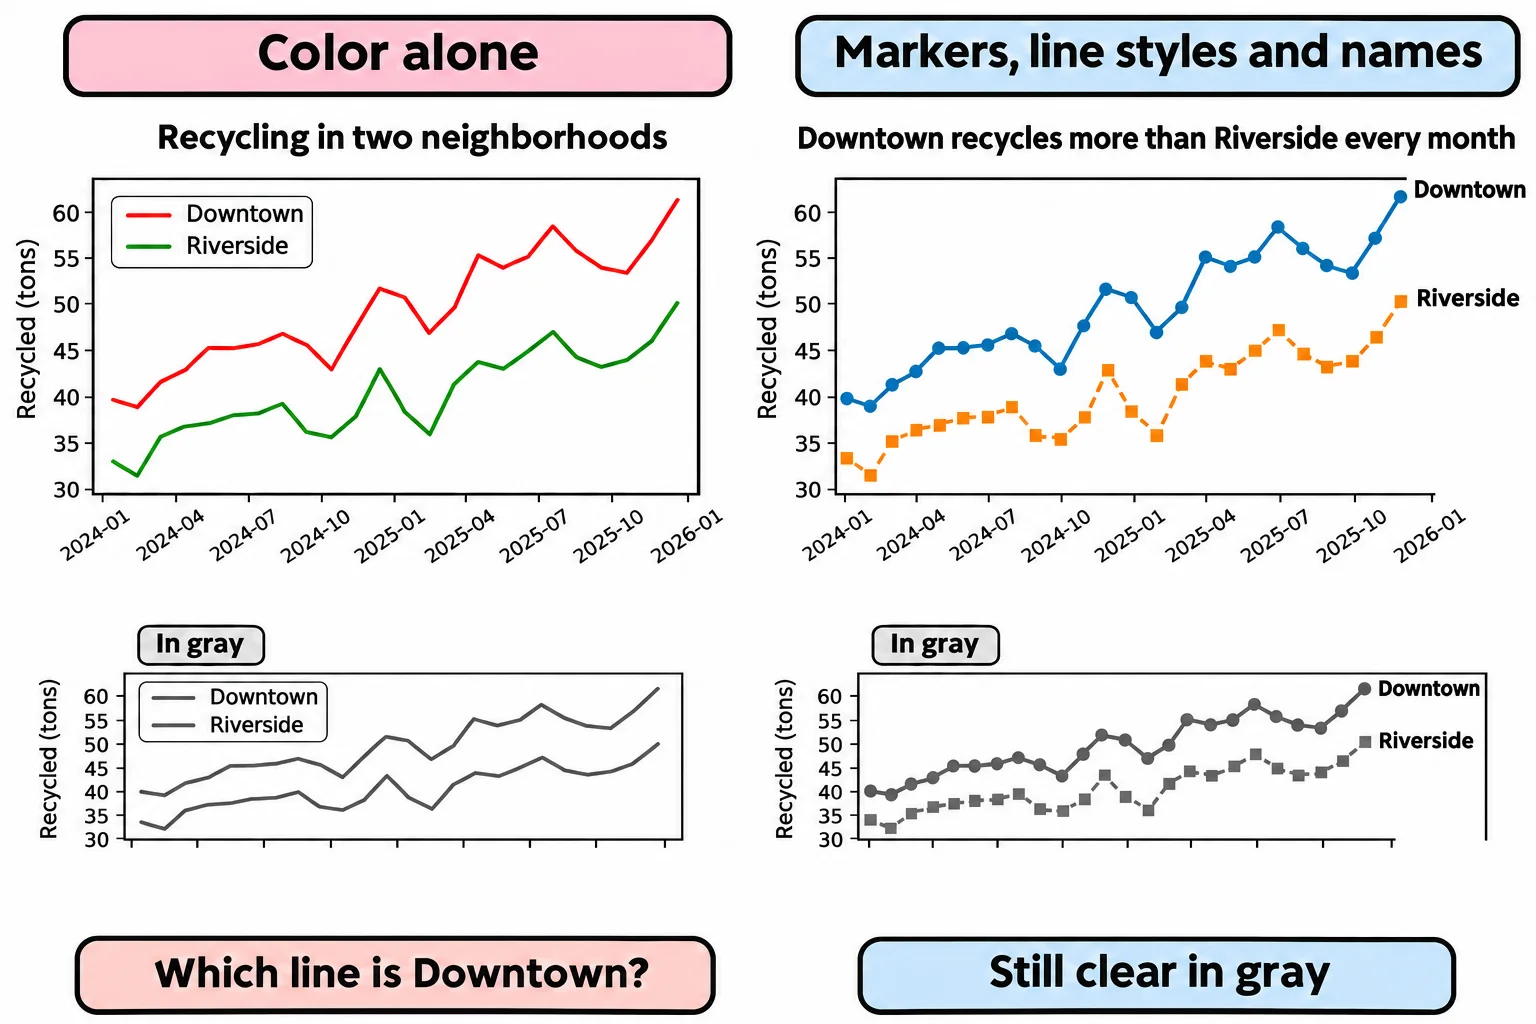
ax.text writes its words at a point in the data's own units: the last month, at each line's last value. The two spaces at the start leave a gap after the line's end. Read back what each line now carries:
for line in ax.get_lines():
    print(line.get_marker(), line.get_linestyle(), line.get_color())
o - #006BA4
s -- #FF800E
Circle and solid, square and dashed: even in gray, the lines can't be confused.
A sentence of alt text
A chart in a report or on a web page is a picture, and a screen reader can't read a picture. Alt text (short for alternative text) is the sentence that stands in for it: what kind of chart it is, what it shows, and its main finding, with a number or two. For the chart above:
Line chart of tons recycled each month in Downtown and Riverside, 2024 to 2025: Downtown recycles more than Riverside in every month, and both rise after curbside pickup began in January 2025.
In a notebook's Markdown cell or a report written in Markdown, it goes in the square brackets of the picture: . A web page uses the alt attribute of its <img> tag. Say what the chart means, not that it has "blue and orange lines".
Check yourself
2 questions to try on the lesson page.
So what
A chart that works without color, at a readable size and with alt text reaches every reader, and it's clearer for the ones who could see it already.