Line Charts: Change Over Time
A line chart shows how a value changed over time, so dates go along the x-axis, a marker shows each measurement, fig.autofmt_xdate() keeps the dates readable, and two lines on one Axes, each with a label= and ax.legend(), compare two groups over the same months.
Apprentice · Python · Updated
After this lesson you can
- Draw a line chart of a value over time with dates on the x-axis, markers and readable date labels
- Draw two lines on one chart with label= and ax.legend(), and explain when a line chart fits
Key takeaways
- A line chart is for change over time. Its line joins measurements that come in order, so it fits days and months, not categories such as flavors.
- Give ax.plot a column of dates for x and matplotlib spaces them like a calendar; marker="o" puts a dot on each real measurement.
- fig.autofmt_xdate() tilts the date labels and makes room for them, so dates that ran into each other can be read.
- Two ax.plot calls draw two lines on the same Axes. Give each a label= and call ax.legend() to show which line is which.
Did sales go up after the new menu? Is the website busier on Mondays? Did the river rise after the storm? Every "how did it change?" question is answered with a line chart, and it's the chart you'll see most in reports, lab write-ups and news stories.
Hilltop Creamery's daily.csv has one row for each day of 2025: the date, the high temperature (high_temp_f), the cones_sold and whether it was rainy. July is the shop's busiest month, and the owner wants to see how it went, day by day.
Dates along the bottom
The cell keeps July's 31 rows and draws a line through them. With parse_dates=["date"], the date column holds real dates, not text, so matplotlib spaces them like a calendar: one step for each day.
import pandas as pd
import matplotlib.pyplot as plt

daily = pd.read_csv("daily.csv", parse_dates=["date"])
july = daily[daily["date"].dt.month == 7]

fig, ax = plt.subplots()
ax.plot(july["date"], july["cones_sold"], marker="o")
ax.set_title("Cones sold each day, July 2025")
ax.set_xlabel("Date")
ax.set_ylabel("Cones sold")
plt.show()
marker="o" puts a dot on each day. The dots are the 31 real measurements; the line between two dots only joins them, since nobody counted cones at midnight. With dots, a reader can count the days and see exactly where each value sits.
The chart has one problem. matplotlib wrote each date in full, 2025-07-01, 2025-07-05 and so on, and side by side under a chart that's only a few inches wide, the dates run into each other.
Readable dates: fig.autofmt_xdate()
One line fixes it:
fig.autofmt_xdate()
fig
fig.autofmt_xdate() tilts every date label (by 30 degrees), lines it up under its tick and makes room at the bottom of the Figure. It's fig, not ax, because the room comes from the sheet of paper. A cell whose last line is fig shows the chart again, now with the change.
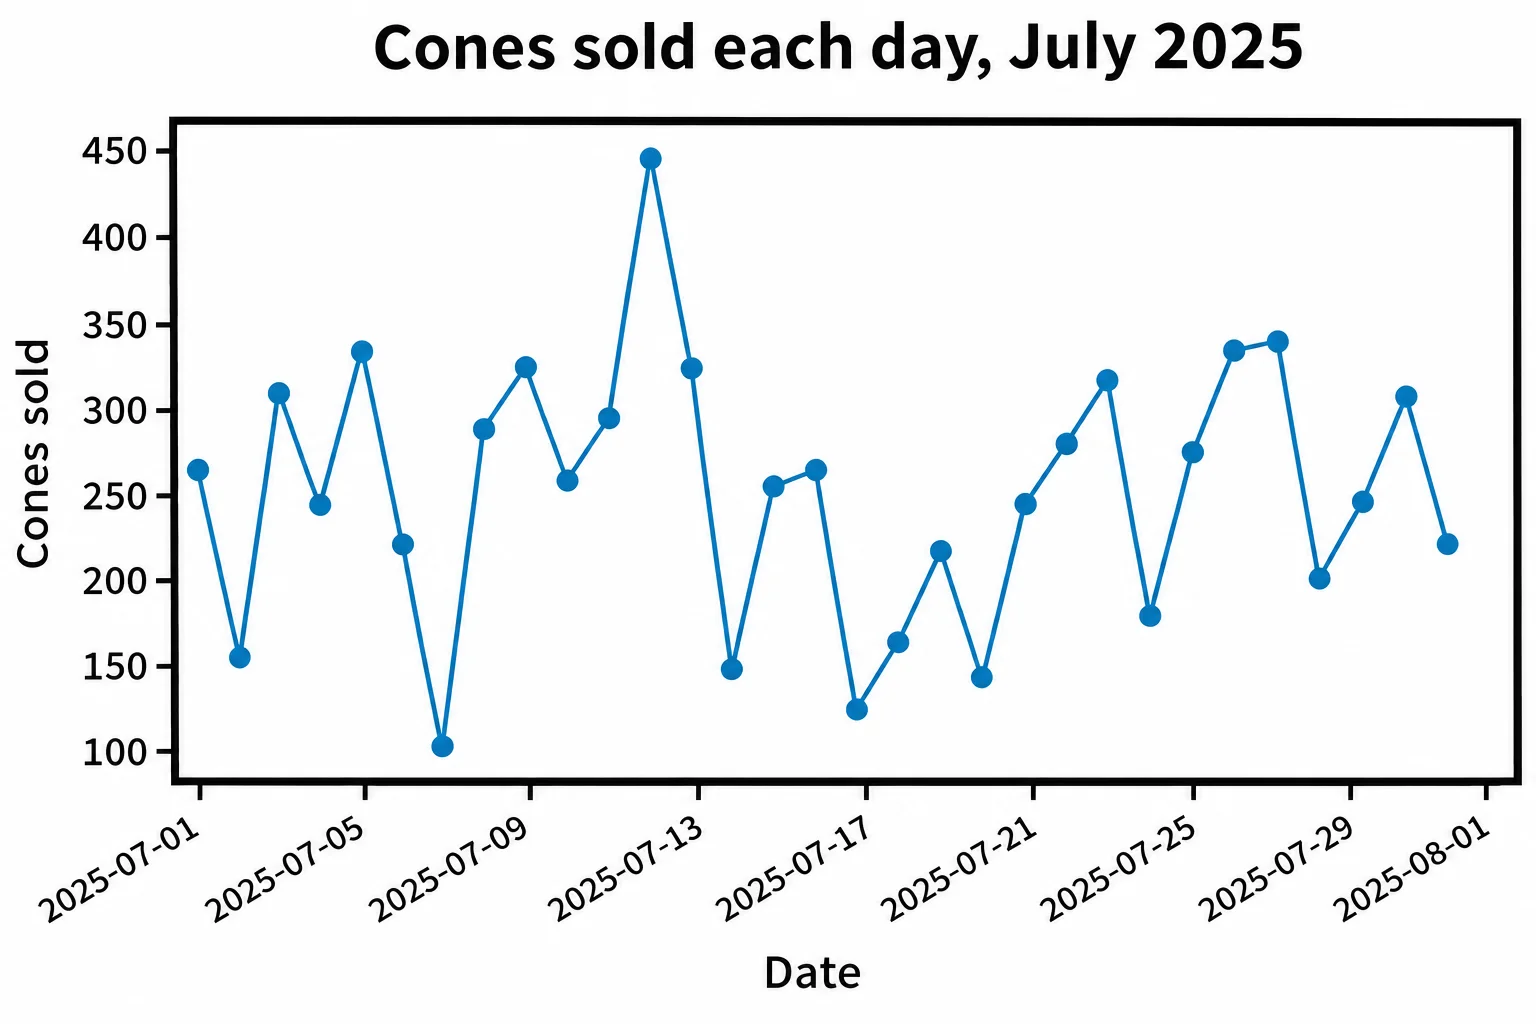
The dots show more than a table would: most days sold 200 to 340 cones, July 12 sold 445, and the low points, such as 103 on July 7 and 124 on July 17, are all rainy days.
Two lines and a legend
That gives the owner a question: how much does rain cost, all year? Average the cones on dry days and on rainy days, month by month, and put both on one chart. Two ax.plot calls draw two lines on the same Axes, and matplotlib gives the second its own color:
daily["month"] = daily["date"].dt.month
dry_days = daily[~daily["rainy"]].groupby("month")["cones_sold"].mean().round()
rainy_days = daily[daily["rainy"]].groupby("month")["cones_sold"].mean().round()

fig, ax = plt.subplots()
ax.plot(dry_days.index, dry_days.values, marker="o", label="Dry days")
ax.plot(rainy_days.index, rainy_days.values, marker="s", label="Rainy days")
ax.set_title("Average cones sold per day, 2025")
ax.set_xlabel("Month")
ax.set_ylabel("Cones sold per day")
ax.legend()
plt.show()
Two lines need a key that says which is which: the legend. label= names each line as it's drawn, and ax.legend() draws the box that lists the names beside a short sample of each line. The second line has square markers (marker="s"), so the two lines differ by more than color.
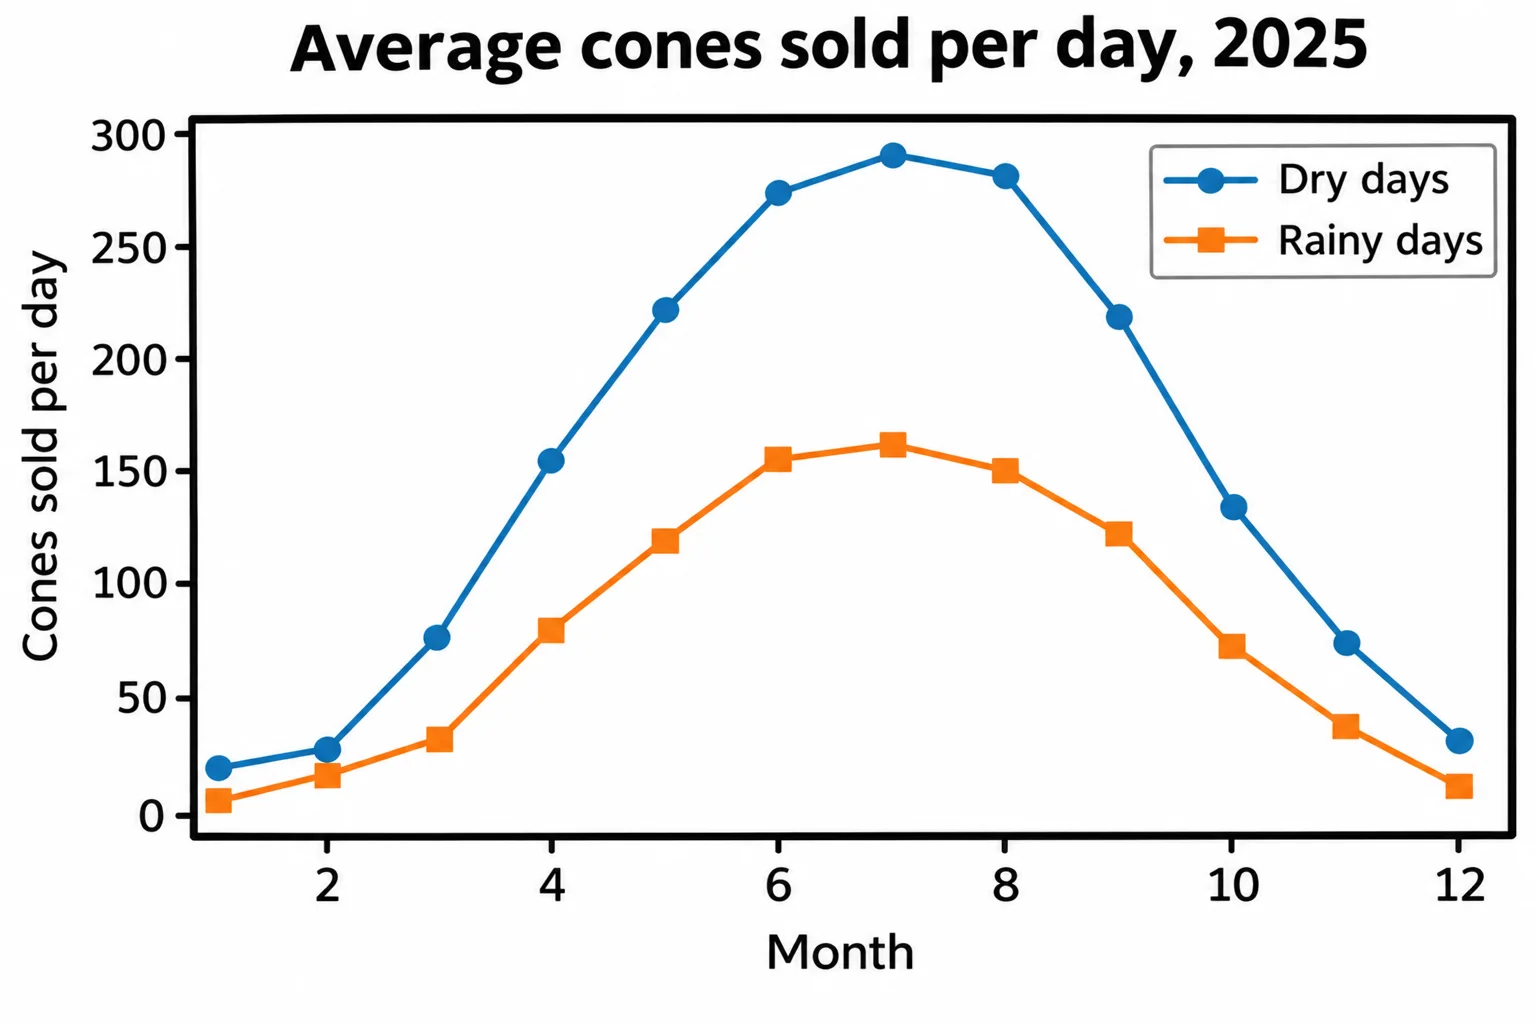
Rainy days sell about half as many cones as dry days, month after month: 162 a day against 291 in July.
When a line fits
A line says: these points come in order, and the way between two of them means something. That's true of days and months, and of anything measured in order, such as a runner's split times. It isn't true of flavors, stores or neighborhoods: a line from one flavor to the next would suggest a change that never happened. Those get bars, in Bar Charts: Comparing Categories.
Check yourself
2 questions to try on the lesson page.
So what
When the question is "how did it change?", put the time along the bottom, draw a line with a dot on each measurement, tilt the dates so they can be read, and give every line a name in a legend.