Scatter Plots: Do Two Things Move Together?
A scatter plot puts one dot for each row at its two measurements, so ax.scatter shows whether two columns move together, alpha shows where the dots crowd, a correlation from -1 to 1 puts the pattern into one number, and two things moving together never proves that one causes the other.
Journeyman · Python · Updated
After this lesson you can
- Draw a scatter plot with ax.scatter, using alpha to show where dots overlap
- Describe a correlation in plain words, and explain why two things moving together doesn't prove one causes the other
Key takeaways
- A scatter plot answers "when one number is bigger, is the other bigger too?" with one dot for each row, placed by its two measurements.
- ax.scatter(x, y) draws the dots; alpha=0.4 makes each dot see-through, so the places where many dots pile up show darker.
- A correlation is a number from -1 to 1. Near 1, the dots rise together in a fairly straight band; near 0, there's no straight-line pattern; near -1, one falls as the other rises.
- Series.corr gives the correlation of two columns, and df.corr() gives every pair of columns at once.
- Two things that move together may both follow something else, so a scatter plot shows a pattern, never on its own a cause.
Do students who sleep more score higher? Do bigger apartments cost more to heat? Does a longer delivery mean a smaller tip? Each of these asks whether two measurements move together, and the chart for that is a scatter plot. It's also how many data projects start: before anyone builds a model, someone draws the dots.
Hilltop Creamery's owner is sure that hot days sell more ice cream. daily.csv has the high temperature (high_temp_f) and the cones_sold for each day of 2025, so the data can say whether she's right, and how strongly.
Two numbers for every day
A line chart wouldn't help here. The days are in date order, not temperature order, so a line through them would zigzag back and forth across the chart. What the question needs is each day as a point: how hot it was, and how many cones it sold. That's a scatter plot, and ax.scatter(x, y) draws one dot for each row:
import pandas as pd
import matplotlib.pyplot as plt

daily = pd.read_csv("daily.csv", parse_dates=["date"])

fig, ax = plt.subplots()
ax.scatter(daily["high_temp_f"], daily["cones_sold"], alpha=0.4)
ax.set_title("Hotter days sell more cones")
ax.set_xlabel("High temperature (°F)")
ax.set_ylabel("Cones sold")
plt.show()
The x value says how far right a dot sits, the y value how high. A cold day with few cones lands at the bottom left; a hot, busy day at the top right.
Crowded dots: alpha
With 365 days, many dots land on top of each other, especially in winter, when the shop sells only a handful of cones a day. A solid dot hides any dots behind it, so 70 cold days could look like 10.
alpha sets how see-through each dot is, from 0 (invisible) to 1 (solid, the default). With alpha=0.4, each dot lets some of the page through, and where dots pile up, the color builds up darker. The darkest patches are where most days were.
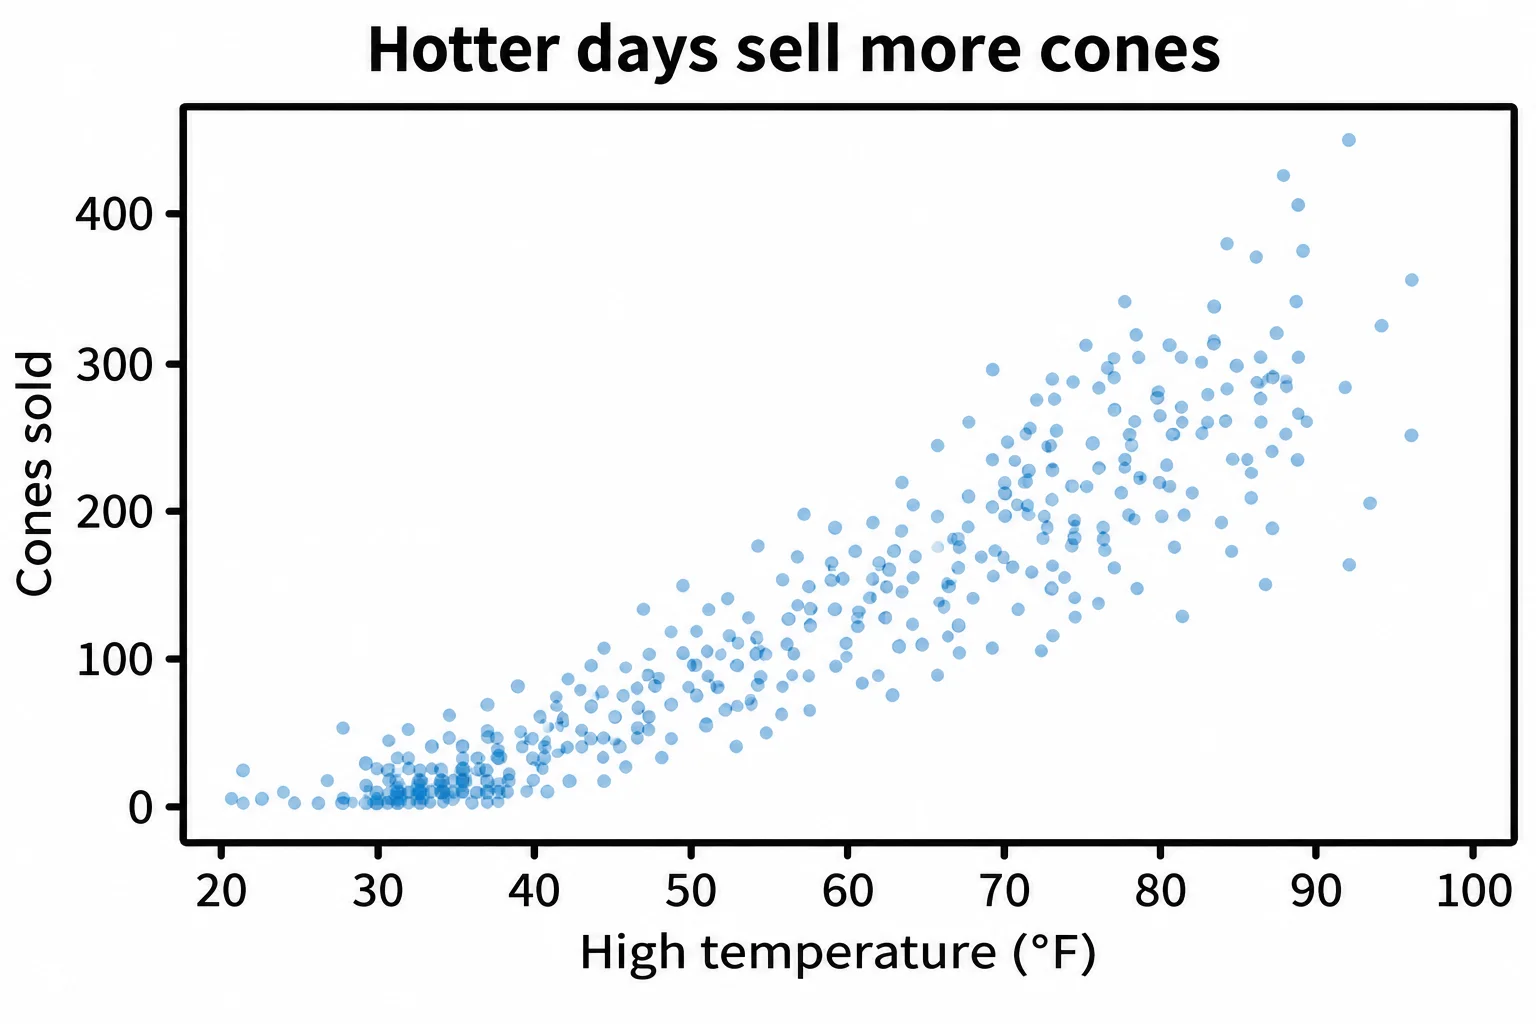
The dots rise from the bottom left to the top right: on hotter days the shop sold more. The band also widens as it climbs: on days of 90°F and above, sales ranged from 164 to 445 cones, because heat isn't the only thing that matters (rain, for one).
One number for the pattern: correlation
A picture says "they rise together"; sometimes a report needs a number. The correlation is that number. It runs from -1 to 1:
- near 1: when one goes up, the other goes up too, in a fairly straight band;
- near 0: no straight-line pattern;
- near -1: when one goes up, the other goes down.
A pandas column can work it out with another column:
r = daily["high_temp_f"].corr(daily["cones_sold"])
print("correlation:", round(r, 2))
correlation: 0.89
0.89 is close to 1: a strong pattern. Statistics classes call this number Pearson's correlation coefficient, and write it r. To see every pair of columns at once, df.corr() builds the whole table:
daily[["high_temp_f", "cones_sold", "rainy"]].corr().round(2)
             high_temp_f  cones_sold  rainy
high_temp_f         1.00        0.89   0.04
cones_sold          0.89        1.00  -0.25
rainy               0.04       -0.25   1.00
Each cell is the correlation of its row with its column, so every column is 1.00 with itself. rainy is True or False, which pandas counts as 1 or 0, and its -0.25 says rainy days sell somewhat fewer cones.
Together isn't the same as cause
On hot days, the shop sells more cones, and the town pool sells more tickets. Cones and pool tickets would have a high correlation, but buying a cone doesn't make anyone buy a pool ticket: the heat drives both. When two things move together, it can be that one causes the other, that a third thing drives both, or that it's chance.
Even for heat and cones, where a cause seems likely, the chart can't prove it on its own. Hot days are also summer days, when school is out and the evenings are long. The scatter plot shows that two numbers move together, and how strongly; why they do is a separate question, one that needs more than one chart.
Check yourself
2 questions to try on the lesson page.
So what
When the question is "do these two move together?", draw one dot for each row, make the dots see-through so crowds show, give the pattern a number with corr, and say what it shows: together, not cause.