Comparing Regression Models
Models are compared fairly only on the same split, with the same metric and a baseline in the table, and putting each model's training error beside its test error shows which ones memorized; the simplest model that's good enough is usually the one to keep.
Journeyman · AI Basics · Python · Updated
After this lesson you can
- Compare regression models on the same split and metric with a baseline, putting each model's training error beside its test error
- Choose the simplest model that's good enough, and explain what a big gap between training and test error warns about
Key takeaways
- Compare models on the same training and test rows, with the same metric, and with a baseline that always guesses the training average.
- Put each model's training error beside its test error. A test error far above the training error says the model memorized its training rows.
- Keep the simplest model whose test error is good enough for the job, and say what it can't do.
- One split is one sample of rows, so a small difference between two models can change with another split.
You now have four ways to guess Hilltop Orchard's harvest: the average, a straight line, a curve and a tree. Which one should the orchard use? That question comes up in every machine learning job, and careless answers are common: score each model a different way, or on different rows, or on the rows it learned from, and the "winner" can be the worst of the lot. This lesson sets up a fair comparison.
The example is Hilltop Orchard's orchard.csv, from Exercise: Orchard Harvest Models, this time with two features: the rain and the tree's age. Each code block is one notebook cell, run in order: the first one loads the data, and the others use what it made.
Same rows, same metric, a baseline
A fair race has one starting line and one stopwatch. For models, that's one split, made once and given to every model, and one metric, here the mean absolute error (MAE), in pounds. And it has one more runner, the baseline: a model that ignores the features and always guesses the training trees' average harvest, DummyRegressor(strategy="mean") (Baselines and Residual Plots introduces it). A model that can't beat it has learned nothing useful.
import pandas as pd
from sklearn.dummy import DummyRegressor
from sklearn.linear_model import LinearRegression
from sklearn.metrics import mean_absolute_error
from sklearn.model_selection import train_test_split
from sklearn.preprocessing import PolynomialFeatures
from sklearn.tree import DecisionTreeRegressor

orchard = pd.read_csv("orchard.csv")
features = ["rainfall_inches", "tree_age_years"]
X_train, X_test, y_train, y_test = train_test_split(
    orchard[features], orchard["apples_lbs"], test_size=0.2, random_state=42
)
poly = PolynomialFeatures(degree=2, include_bias=False)
curve_train = poly.fit_transform(X_train)
curve_test = poly.transform(X_test)
The curve learns from its own columns, made as Curves with Polynomial Features shows, so each model below comes with the training and test tables it uses. (Pipelines: Every Step, Every Time, in Module 4, joins the two steps into one model.)
Training error beside test error
Each model is fit on the training trees, then scored twice: on the trees it learned from, and on the test trees it never saw.
models = {
    "average (baseline)": (DummyRegressor(strategy="mean"), X_train, X_test),
    "straight line": (LinearRegression(), X_train, X_test),
    "curve, degree 2": (LinearRegression(), curve_train, curve_test),
    "tree, depth 3": (DecisionTreeRegressor(max_depth=3, random_state=0), X_train, X_test),
    "tree, no limit": (DecisionTreeRegressor(random_state=0), X_train, X_test),
}
rows = []
for name, (model, train_part, test_part) in models.items():
    model.fit(train_part, y_train)
    rows.append({
        "model": name,
        "training MAE": mean_absolute_error(y_train, model.predict(train_part)),
        "test MAE": mean_absolute_error(y_test, model.predict(test_part)),
    })
results = pd.DataFrame(rows).set_index("model").round(1)
print(results)
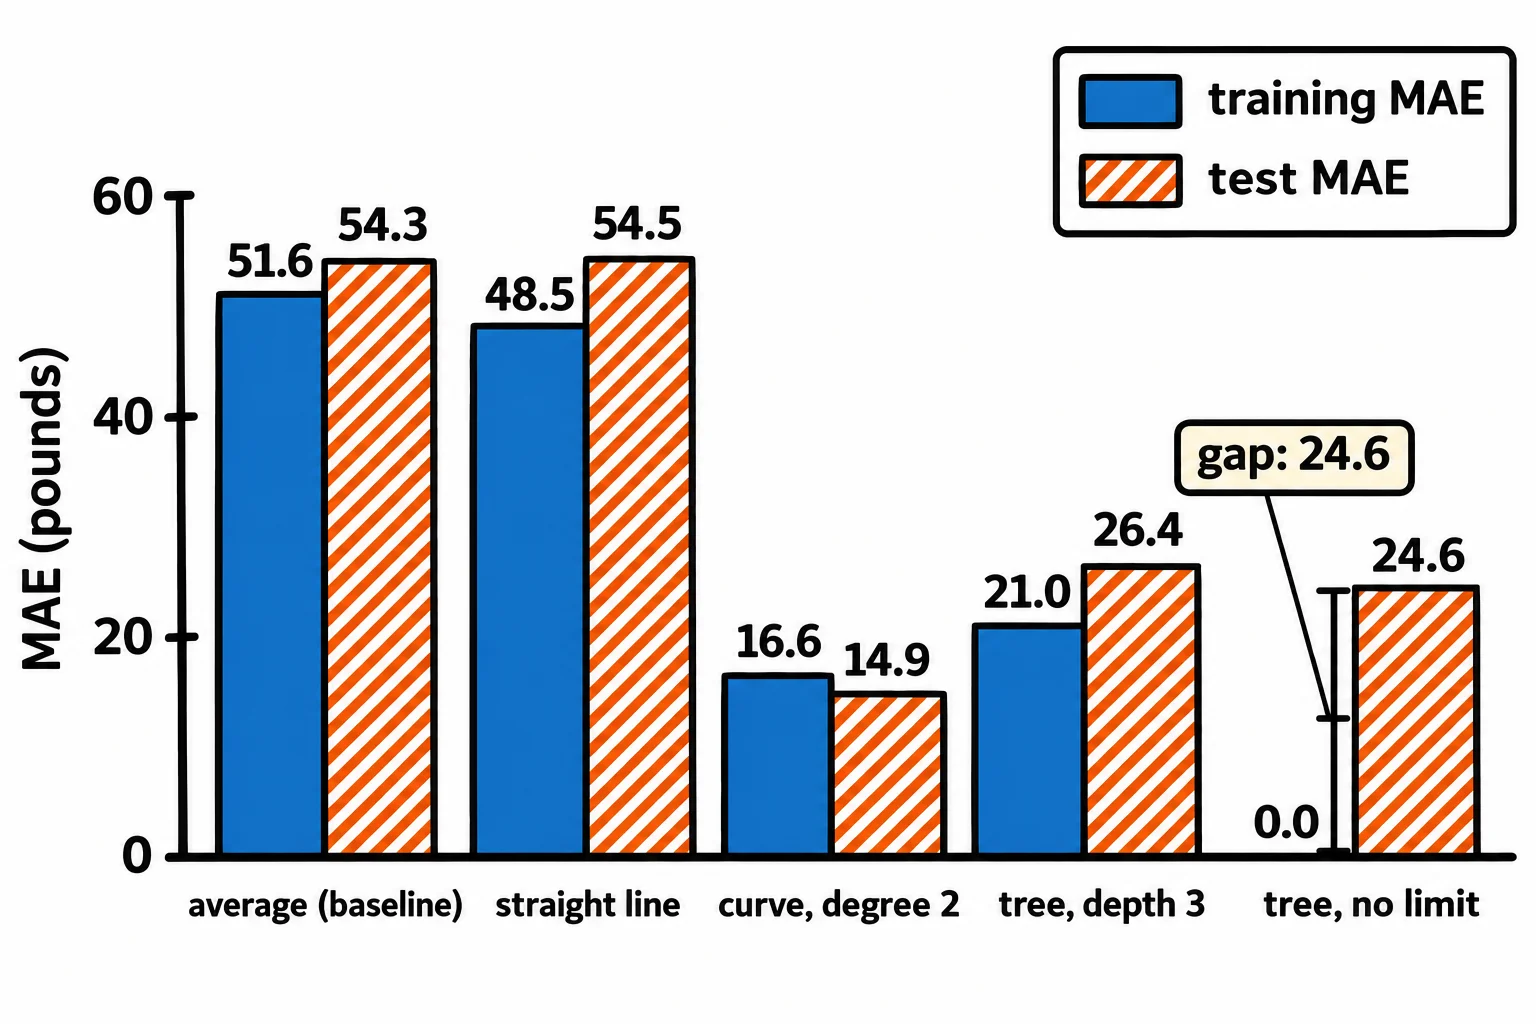
                    training MAE  test MAE
model
average (baseline)          51.6      54.3
straight line               48.5      54.5
curve, degree 2             16.6      14.9
tree, depth 3               21.0      26.4
tree, no limit               0.0      24.6
Read the test column first: it's the honest one. The straight line is no better than always guessing the average, 54.5 pounds against 54.3: on a hump, a line has nothing to offer. The curve is best, off by about 15 pounds. Both trees beat the line by a lot.
Now the training column. Sorted by it, the tree with no limit wins with a perfect 0.0. Sorted by the test column, it comes third. That's why a training score never picks the winner.
What a big gap says
The gap, test error minus training error, says how much worse a model does on rows it never saw:
results["gap"] = results["test MAE"] - results["training MAE"]
print(results["gap"])
model
average (baseline)     2.7
straight line          6.0
curve, degree 2       -1.7
tree, depth 3          5.4
tree, no limit        24.6
Name: gap, dtype: float64
A small gap is normal: new rows are a little harder than the ones a model learned from. The curve's gap is even negative, because these 40 test trees happen to be a little easier to guess than the training trees. The tree with no limit has a gap of 24.6 pounds: it learned each training tree's random wobble, not the pattern, and that wobble doesn't come back in new trees. A big gap is the warning sign of overfitting; Module 4 shows how to see it, measure it and fix it.
One split is also one sample of 40 trees. With random_state set to 0, 1, 2 and 3 instead of 42, the curve's test MAE ran from 15.5 to 19.9 pounds and stayed the best each time, but a difference of a pound or two between two models could flip with another split. Cross-Validation, in Module 4, scores a model on several splits for exactly that reason.
The simplest model that's good enough
Here the curve is both the most accurate and one of the simplest: five coefficients and an intercept that you can write down. Before choosing, ask:
- Good enough for what? About 15 pounds on harvests of 111 to 385 pounds may be fine for planning crates, and not fine for a contract that pays by the pound.
- What can't it do? The curve only knows the shape you gave it, squared rain, and it was trained on 10 to 49 inches of rain; a 60-inch season is a guess beyond its data.
- Would something simpler do? If two models score about the same, keep the simpler one: it's easier to explain, check and fix.
The trees have their own trade-off: they found the hump without being told its shape, which matters when you can't guess the shape, but they guess in steps and can't go past the harvests they saw.
Check yourself
2 questions to try on the lesson page.
So what
A fair comparison uses one split, one metric and a baseline, reads the test column, checks each model's gap, and keeps the simplest model that's good enough for the job.
Sources
- scikit-learn, Metrics and scoring: Dummy estimators, User Guide: comparing an estimator against simple rules of thumb is a sanity check;
DummyRegressor'smeanstrategy always predicts the mean of the training targets and ignores the input data. - scikit-learn, Metrics and scoring: Mean absolute error, User Guide:
mean_absolute_errorcomputes the mean absolute error. - scikit-learn, Decision Trees, User Guide: over-complex trees that don't generalize are overfitting, and setting the maximum depth helps avoid it.
- scikit-learn, Cross-validation: evaluating estimator performance, User Guide, its opening: a model that repeats the labels of the samples it has seen would score perfectly and fail on unseen data, which is why a test set is held out.