Wide to Long with melt
A wide table keeps one kind of value in many columns, a column per quiz, which reads well but is hard to filter and group, and melt turns it into a long table with one row per value, named with id_vars, var_name and value_name, the shape textbooks call tidy data.
Journeyman · Python · Updated
After this lesson you can
- Turn a wide table into a long one with melt, using id_vars, var_name and value_name
- Explain what makes a table tidy, and why a long table is easier to filter and group than a wide one
Key takeaways
- A wide table has a column for each quiz; a long table has one row for each student's score on each quiz.
- melt keeps the id_vars columns, turns every other column's name into a value of var_name and its number into a value of value_name.
- Melting 240 students with 4 quiz columns gives 240 times 4, 960 rows. Check the count.
- A long table answers questions about every score at once, with one filter or one groupby, however many quizzes there are.
A gradebook, a sales report by month, a survey with a column per question: people lay data out with one column for each thing they measured, because a row like that reads well from left to right. Then the questions start ("how many scores are under 60?", "which quiz was hardest?"), and that layout gets in the way. Changing a table's shape is a step you'll take in almost every analysis of data that someone laid out for reading.
The example is Oakridge Middle School's fall_scores.csv: 240 students, a student_id and a column for each of four quizzes, quiz_1 to quiz_4.
A question the shape makes hard
import pandas as pd

fall = pd.read_csv("fall_scores.csv")
fall.head(3)
   student_id  quiz_1  quiz_2  quiz_3  quiz_4
0        1001      74      59      84      72
1        1002      85      74      76      79
2        1003      78      74      77      77
The counselor asks how many fall scores were under 60, to plan extra help. The scores sit in four columns, so you count each column and add the counts up:
quizzes = ["quiz_1", "quiz_2", "quiz_3", "quiz_4"]
low = 0
for quiz in quizzes:
    low = low + (fall[quiz] < 60).sum()
print("scores under 60:", low)
scores under 60: 69
It works, but every question about "all the scores" needs that loop, and when a fifth quiz is added, every loop needs its list changed. The trouble is the shape: one kind of value, a score, is spread across four columns.
melt: a column per quiz becomes a row per quiz
Think of a report card with a box for each quiz, and the same results written as a list, one line per quiz: "1001, quiz_1, 74", "1001, quiz_2, 59", and so on. The report card is wide: a column for each quiz. The list is long: one row for each score. melt turns the first into the second:
long = fall.melt(id_vars="student_id", var_name="quiz", value_name="score")
print("rows before:", len(fall))
print("rows after:", len(long))
long.head(3)
rows before: 240
rows after: 960
   student_id    quiz  score
0        1001  quiz_1     74
1        1002  quiz_1     85
2        1003  quiz_1     78
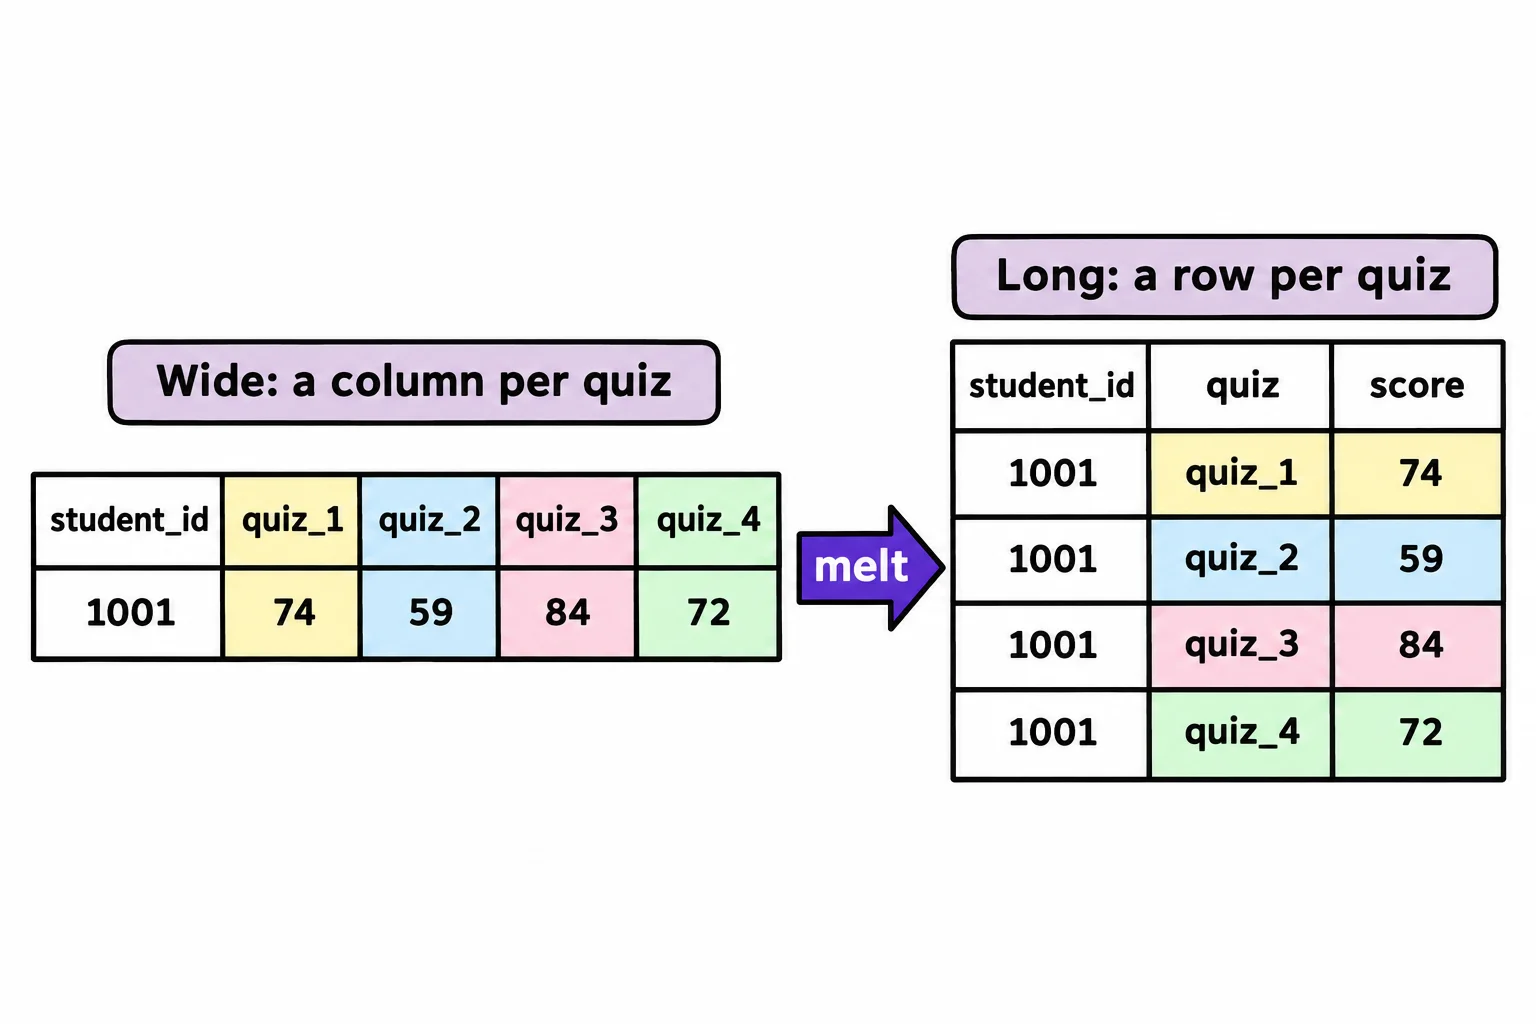
melt lists every student's quiz_1 first, then every quiz_2. Here is student 1001's part of the long table:
long[long["student_id"] == 1001]
     student_id    quiz  score
0          1001  quiz_1     74
240        1001  quiz_2     59
480        1001  quiz_3     84
720        1001  quiz_4     72
id_vars, var_name and value_name
Each of melt's three settings answers a question:
id_vars: which columns say whose row it is? They're copied onto every new row. Here,student_id.var_name: what's the name for the old column names? They become values in this column:quiz.value_name: what's the name for the numbers?score.
Leave the last two out and pandas names them variable and value, which works but says nothing; fall.melt(id_vars="student_id") gives those columns. The row count is the honest check: 240 students times 4 quiz columns is 960 rows. If you stacked fall and spring first, with a term column as Stacking Tables with concat shows, both student_id and term say whose row it is, so both go in id_vars=["student_id", "term"], and the year melts into 1,920 rows.
Why long is easier: tidy data
Now the counselor's question is one line, and it stays one line however many quizzes there are:
print("scores under 60:", (long["score"] < 60).sum())
scores under 60: 69
So is "which quiz was hardest?", a groupby on the quiz column, as Grouping with groupby shows:
long.groupby("quiz")["score"].mean().round(1)
quiz
quiz_1    77.6
quiz_2    71.0
quiz_3    80.3
quiz_4    75.3
Name: score, dtype: float64
Quiz 2 was the hardest. In your textbook, a table shaped like long is called tidy data: each row is one observation (one student's score on one quiz), and each column is one kind of value (who, which quiz, what score). Most of pandas, and the charts in the next module, are built to work on tidy tables. Wide tables stay the right shape for people to read, which is what Long to Wide with pivot turns them back into.
Check yourself
2 questions to try on the lesson page.
So what
When one kind of value is spread across many columns, melt gathers it into one, and every question about all of those values becomes a single filter or groupby.