Reports: ConvertTo-Html and Out-GridView
ConvertTo-Html turns objects into a web page with a table, which a little CSS makes clear to read and anyone can open in a browser, and Out-GridView shows objects in a window you can filter, sort and click, where -PassThru sends the rows you pick on down the pipe.
Journeyman · PowerShell · Operating System · Updated
After this lesson you can
- Turn objects into a web-page report with ConvertTo-Html, with a heading and a little CSS
- Look through objects in a window with Out-GridView, and send the rows you pick down the pipe with -PassThru
- Choose between Export-Csv, ConvertTo-Json, ConvertTo-Html and Out-GridView for where the data goes next
Key takeaways
ConvertTo-Htmlturns objects into a web page with one table row each;-PreContentadds a heading above the table and-Headadds a title and a<style>block.- CSS is the set of rules for how a page looks: borders, spacing and colors, written as
th { background: #2f9e44; }. Out-GridViewshows objects in a window you can filter and sort with the mouse. It's on Windows only.- With
-PassThru, the rows you pick in that window and send with OK go on down the pipe: the terminal and the mouse together.
Every month the owner of Maple Street Bikes wants to know how the rentals went: which bikes went out, and what they earned. A table in your terminal is the answer for you, but you can't email a terminal, and pasting it into an email loses the columns. People read reports in a browser or an inbox. This lesson turns the month's rentals into a web page anyone can open, then shows Out-GridView, a window where you look through rows and pick some with the mouse. An IT tech's weekly disk report and a shop's monthly sales page are made the same way. (The web page works everywhere; Out-GridView is Windows only.)
This lesson uses rentals-2026-10-clean.csv, the file you cleaned in Saving Data: Export-Csv and Cleaning a CSV. If you don't have it, this line makes it. Running it again is safe.
Set-Content -Path "$HOME\terminal-practice\bike-shop\rentals-2026-10-clean.csv" -Value 'Date,Store,Bike,Hours,Fee', '2026-10-02,Downtown,City Bike,3,36', '2026-10-04,Riverside,E-Bike,2,50', '2026-10-09,Downtown,E-Bike,4,100', '2026-10-12,Riverside,City Bike,2,24', '2026-10-17,Downtown,Kids Bike,1,8', '2026-10-24,Riverside,E-Bike,6,150', '2026-10-30,Downtown,City Bike,5,60'
A web page from objects: ConvertTo-Html
First the numbers: one pile per bike with Group-Object, three columns made with calculated properties, the biggest income first. The summary goes into a variable, $summary, as in JSON: ConvertFrom-Json and ConvertTo-Json, so the next steps can use it without building it again:
Set-Location "$HOME\terminal-practice\bike-shop"
$summary = Import-Csv rentals-2026-10-clean.csv |
    Group-Object Bike |
    Select-Object @{ Name = 'Bike'; Expression = { $_.Name } },
        @{ Name = 'Rentals'; Expression = { $_.Count } },
        @{ Name = 'Income'; Expression = { ($_.Group | Measure-Object Fee -Sum).Sum } } |
    Sort-Object Income -Descending
$summary
Bike      Rentals Income
----      ------- ------
E-Bike          3 300.00
City Bike       3 120.00
Kids Bike       1   8.00
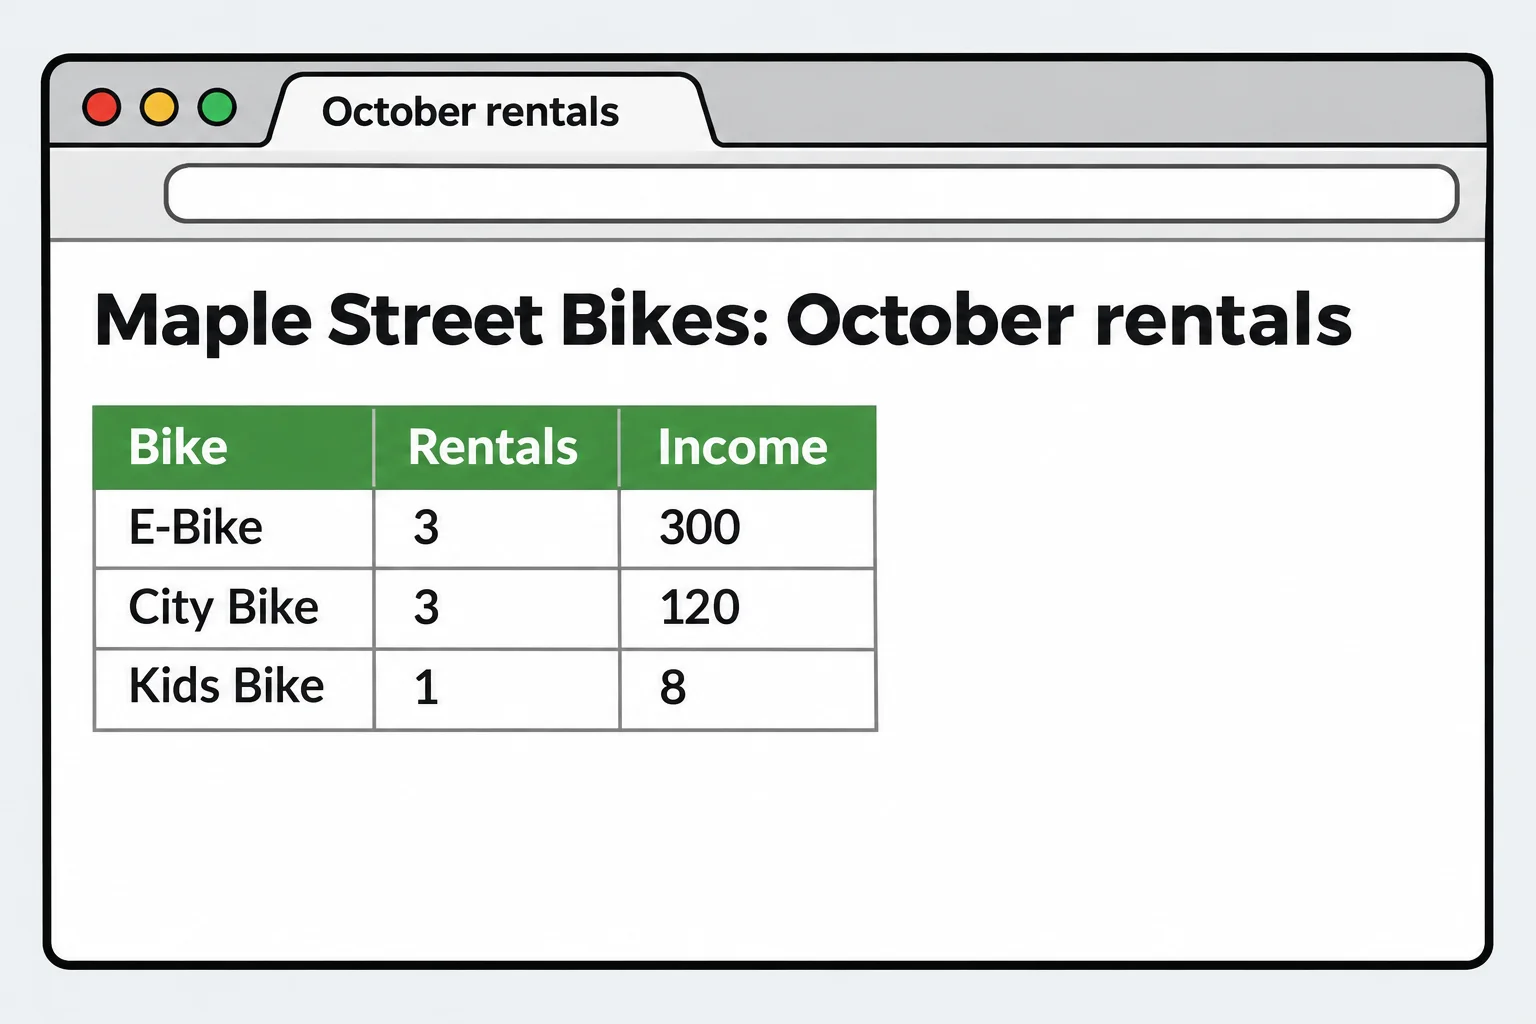
Web pages are written in HTML, text with tags in angle brackets: <table> (read "table tag") starts a table, <tr> a table row, <th> a heading cell and <td> an ordinary cell. ConvertTo-Html writes it for you, one row per object. -Title names the browser tab, and -PreContent puts a heading above the table:
$summary | ConvertTo-Html -Title 'October rentals' -PreContent '<h1>Maple Street Bikes: October rentals</h1>'
<!DOCTYPE html PUBLIC "-//W3C//DTD XHTML 1.0 Strict//EN"  "http://www.w3.org/TR/xhtml1/DTD/xhtml1-strict.dtd">
<html xmlns="http://www.w3.org/1999/xhtml">
<head>
<title>October rentals</title>
</head><body>
<h1>Maple Street Bikes: October rentals</h1>
<table>
<colgroup><col/><col/><col/></colgroup>
<tr><th>Bike</th><th>Rentals</th><th>Income</th></tr>
<tr><td>E-Bike</td><td>3</td><td>300</td></tr>
<tr><td>City Bike</td><td>3</td><td>120</td></tr>
<tr><td>Kids Bike</td><td>1</td><td>8</td></tr>
</table>
</body></html>
You don't need to read HTML to use it. Find the three bikes in the <td> cells, and that's the report.
A little CSS, then save and open it
A plain HTML table has no borders and no colors. CSS is the set of rules a browser uses to decide how a page looks, each one a thing to style, then its settings in curly braces: th { background: #2f9e44; color: white; } reads "heading cells get a green background and white text". A few rules go a long way. They go in a <style> block, which -Head puts at the top of the page. -Head replaces what -Title would write, so the title goes in it too:
$head = '<title>October rentals</title><style> body { font-family: sans-serif; } table { border-collapse: collapse; } th, td { border: 1px solid #999; padding: 4px 12px; } th { background: #2f9e44; color: white; } </style>'
$summary | ConvertTo-Html -Head $head -PreContent '<h1>Maple Street Bikes: October rentals</h1>' | Set-Content rentals-report.html
Invoke-Item rentals-report.html
Set-Content saves the page as rentals-report.html, replacing it if it's there, and Invoke-Item opens it in your web browser. It's an ordinary file: email it, or put it in a shared folder, and anyone can open it with a double-click.
Look and pick: Out-GridView
Sometimes there's no rule for which rows you want: you'll know them when you see them. Say the owner wants to send a "how was your ride?" email after the longest e-bike rentals. Out-GridView shows objects in a window, where you type in the Filter box to narrow the rows and click a column heading to sort:
Import-Csv rentals-2026-10-clean.csv | Out-GridView -Title 'October rentals'
With -PassThru the window gets OK and Cancel buttons, and PowerShell waits. Click the rows you want (hold Ctrl to pick more than one), click OK, and they go on down the pipe like any other objects. Here they're saved as a list for the emails:
Import-Csv rentals-2026-10-clean.csv | Out-GridView -Title 'Pick the rentals to follow up' -PassThru | Export-Csv follow-up.csv
Get-Content follow-up.csv
With the two longest e-bike rentals picked, the file holds those two:
"Date","Store","Bike","Hours","Fee"
"2026-10-09","Downtown","E-Bike","4","100"
"2026-10-24","Riverside","E-Bike","6","150"
That's the terminal and the mouse together, as The Terminal and the Mouse: Two Ways In promised: the command gathers the data, your eyes and a click choose, and the command carries on. Cancel sends nothing on.
Out-GridView is on Windows only, in PowerShell 7 and in Windows PowerShell 5.1. On a Mac or Linux the command isn't there; the Microsoft.PowerShell.ConsoleGuiTools module, from the PowerShell Gallery, adds Out-ConsoleGridView, which works the same way inside the terminal.
Where is the data going?
You now have four ways to send data on. Pick by who, or what, reads it next:
| Where it's going | The command |
|---|---|
| Excel, or another program that reads tables | Export-Csv |
| An app's settings, or a website that wants JSON | ConvertTo-Json |
| A person, in a browser or an email | ConvertTo-Html |
| You, right now, to look through and pick from | Out-GridView |
Try it. Make a second report, stores-report.html, with one row per store: its rentals and income. Pick a color of your own for the heading cells.
Check yourself
2 questions to try on the lesson page.
So what
The data is the same whoever reads it; ConvertTo-Html makes it a page a person can open, and Out-GridView -PassThru lets your eyes choose while the pipeline does the rest.