Charts Straight from pandas: df.plot
Every DataFrame and Series has a plot method that draws it with matplotlib, so kind= picks a line, bar, barh, scatter or hist chart, ax=ax draws it on an Axes you made, a groupby result can be plotted at the end of the same chain, and what comes back is the same matplotlib Axes you label, save and test.
Journeyman · Python · Updated
After this lesson you can
- Draw a chart straight from a DataFrame or Series with .plot(kind=..., ax=ax)
- Plot a groupby result, and explain that pandas' plot returns the same matplotlib Axes
Key takeaways
- A Series' plot() draws its index along the x-axis and its values up the y-axis; kind= picks the chart, and a line is the default.
- kind="bar", "barh", "scatter" and "hist" make the other charts, and a DataFrame's plot takes x= and y= to name its columns.
- Pass ax=ax to draw on an Axes from plt.subplots(). pandas then hands back that same Axes, so set_title, bar_label and fig.savefig work as before.
- A groupby result is a Series, so grouping, sorting and plotting fit in one chain that ends in .plot(kind="bar", ax=ax).
- pandas fills in some labels itself, such as the index's name under the x-axis; check them and set your own.
Most of the time, the table you want to chart is already in pandas: a groupby result, a column of a DataFrame, a pivot table. pandas can draw it for you in one line, and the line is short enough that you'll use it for every quick look while you explore. It's still matplotlib doing the drawing, so everything from this chapter's earlier lessons keeps working.
The example is Hilltop Creamery's year again: daily.csv, one row for each day of 2025, with the date, the high temperature (high_temp_f), the cones_sold and whether it was rainy.
The same chart, one line shorter
In Figures and Axes: How matplotlib Draws, a chart of the cones sold each month took an ax.plot with the index and the values. A Series can draw itself:
import pandas as pd
import matplotlib.pyplot as plt

daily = pd.read_csv("daily.csv", parse_dates=["date"])
monthly = daily.groupby(daily["date"].dt.month)["cones_sold"].sum()

fig, ax = plt.subplots()
monthly.plot(ax=ax, marker="o")
ax.set_title("Cones sold each month, 2025")
ax.set_ylabel("Cones sold")
plt.show()
.plot() puts the Series' index (the months) along the x-axis and its values up the y-axis, and draws a line, the default. ax=ax tells pandas to draw on the Axes you made, and other options such as marker="o" go straight on to matplotlib.
pandas also labels the x-axis itself, with the index's name:
ax.get_xlabel()
'date'
The index is named date because the months came from the date column, and "date" is a poor label for month numbers. pandas' guesses are a start, not a finish: ax.set_xlabel("Month") replaces it.
kind= picks the chart
kind= chooses which of the four charts pandas draws, and each one is a matplotlib call you already know:
kind= |
Draws | The same as |
|---|---|---|
"line" (the default) |
a line chart | ax.plot |
"bar", "barh" |
a bar chart, upright or sideways | ax.bar, ax.barh |
"scatter" |
a scatter plot, from a DataFrame's x= and y= columns |
ax.scatter |
"hist" |
a histogram, with bins= |
ax.hist |
A DataFrame names its columns with x= and y=, so the scatter plot from Scatter Plots: Do Two Things Move Together? is one line:
fig, ax = plt.subplots()
daily.plot(kind="scatter", x="high_temp_f", y="cones_sold", alpha=0.4, ax=ax)
ax.set_title("Hotter days sell more cones")
plt.show()
Here pandas labels the axes with the column names, high_temp_f and cones_sold. Fine while you explore; a chart for someone else gets set_xlabel and set_ylabel in words, with units.
A groupby result, plotted
The owner asks which day of the week sells the most cones, to plan the staff schedule. A groupby answers it, sorting puts the busiest day first, and .plot draws it, all in one chain:
by_weekday = daily.groupby(daily["date"].dt.day_name())["cones_sold"].mean().round()

fig, ax = plt.subplots()
by_weekday.sort_values(ascending=False).plot(kind="bar", ax=ax, rot=0)
ax.set_title("Average cones sold by day of the week, 2025")
ax.set_xlabel("Day")
ax.set_ylabel("Cones sold per day")
plt.show()
Without the sort, the days would come out in alphabetical order, Friday first, as groupby sorts its labels. And pandas turns a bar chart's labels sideways unless you say otherwise: rot=0 keeps the day names level.
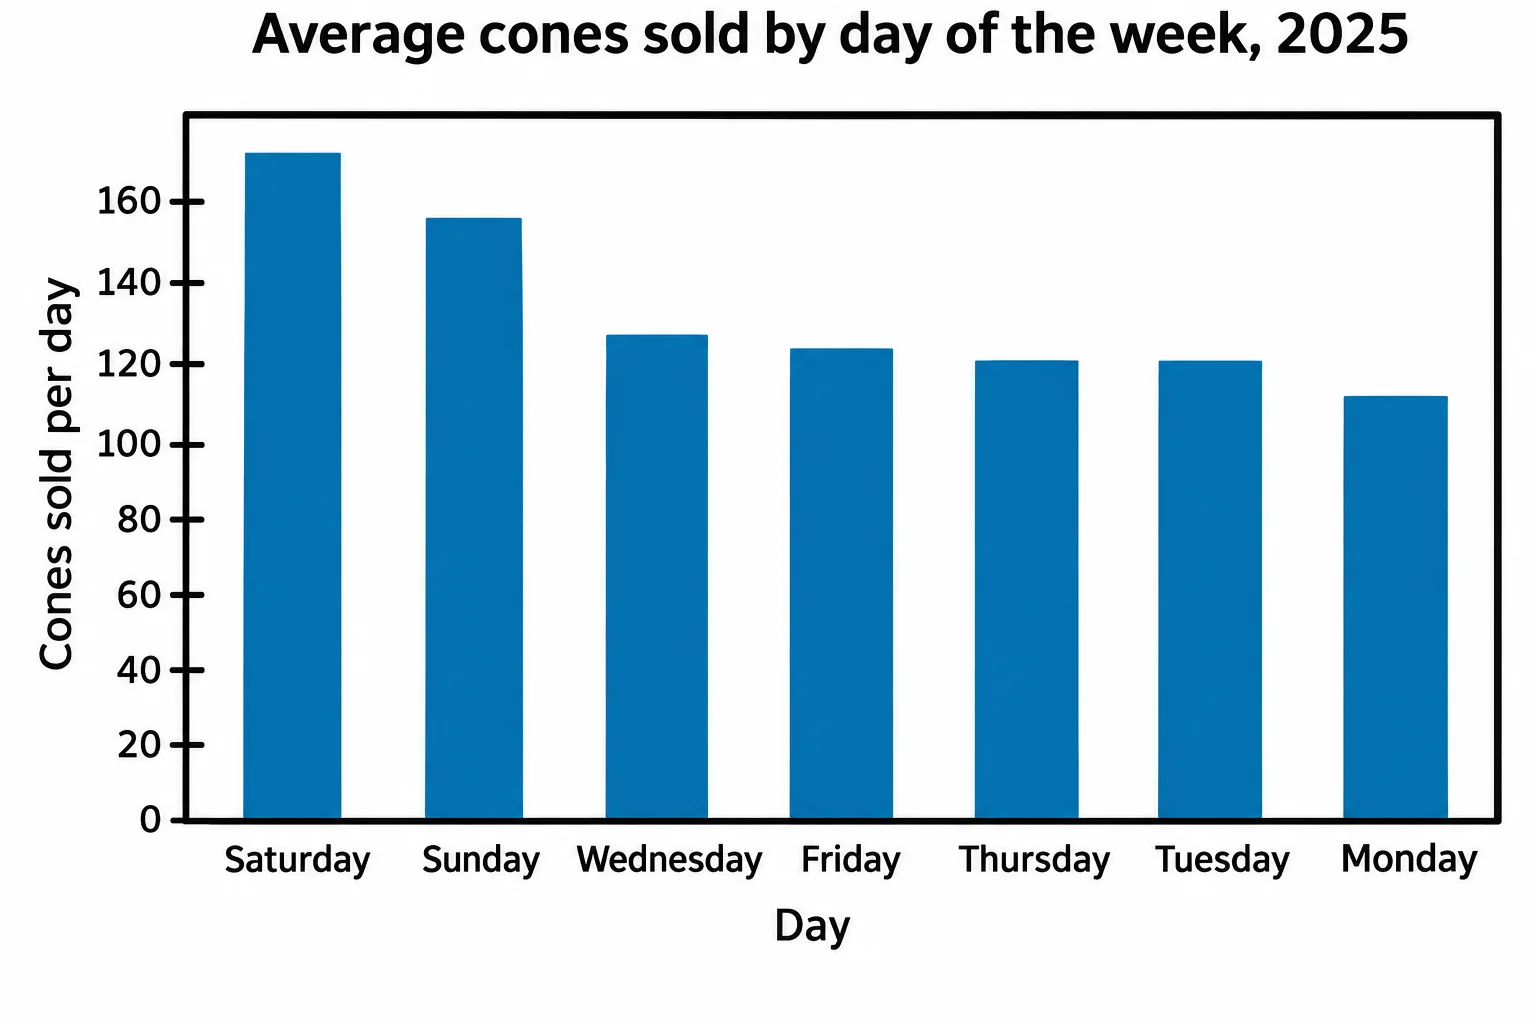
Saturday and Sunday sell the most, 171 and 156 cones a day, against 113 to 127 on the weekdays, so that's where the extra staff goes.
It's matplotlib underneath
.plot hands back the Axes it drew on. When you pass ax=ax, that's your own Axes:
fig, ax = plt.subplots()
returned = monthly.plot(ax=ax)
print(returned is ax)
plt.show()
True
is asks "are these the very same object?", and they are. (Leave out ax= and pandas makes its own Figure and hands back its Axes instead; returned.figure is the Figure, for savefig.) So a pandas chart is a matplotlib chart: set_title, bar_label, fig.autofmt_xdate() and fig.savefig all work on it, and a test reads it the same way. This course makes the Axes first and passes ax=ax, for the reasons Figures and Axes: How matplotlib Draws gives.
Check yourself
2 questions to try on the lesson page.
So what
When the data is already in pandas, .plot(kind=..., ax=ax) draws it in one line, at the end of the chain that made it, and hands back the same Axes, so labeling, saving and testing work as they always have.