Tables for Data: Rows, Columns and Styling Them
When data has rows and columns that mean something, such as prices, opening hours or high scores, a table holds it, so you write it with caption, thead, tbody, th and td, then make it readable with border-collapse, padding, aligned numbers, stripes and a box that scrolls on a phone.
Apprentice · CSS · HTML · Updated
After this lesson you can
- Write a data table with caption, thead, tbody, tr, th with scope and td, and choose a table over a list for rows and columns
- Style a table with border-collapse, cell padding, lines between rows, aligned numbers and striped rows, and let a wide table scroll in its box
Key takeaways
- Use a table when the data has rows and columns that mean something together, each row one thing and each column one fact about it. One column of similar things is a list.
- A table holds a caption, a thead with the heading row and a tbody with the data rows. Each row is a tr of th heading cells and td data cells.
- scope="col" or scope="row" on a th tells a screen reader which cells it labels, so it can name the column as its user moves through the data.
- border-collapse: collapse on the table merges each pair of cell borders into one line. Padding on th and td gives the data room, and numbers line up on the right.
- Stripe the data rows with tbody tr:nth-child(even), and put a wide table in a box with overflow-x: auto, so on a phone the box scrolls instead of the page.
A coffee shop's prices by size, a store's opening hours by day, a class schedule, a game's high scores, a team's results: some data is a grid of facts, read across and down. You'll meet it on nearly every site you build, often on a small business's own site, and a grid of facts in plain text is hard to read. HTML has an element for it, the table, and a few lines of CSS turn the browser's cramped default into something people can scan in a second.
Paws & Whiskers wants a page of adoption fees: each pet, what kind of animal it is, its age and its fee, so a family can compare them before they visit.
Rows and columns that mean something
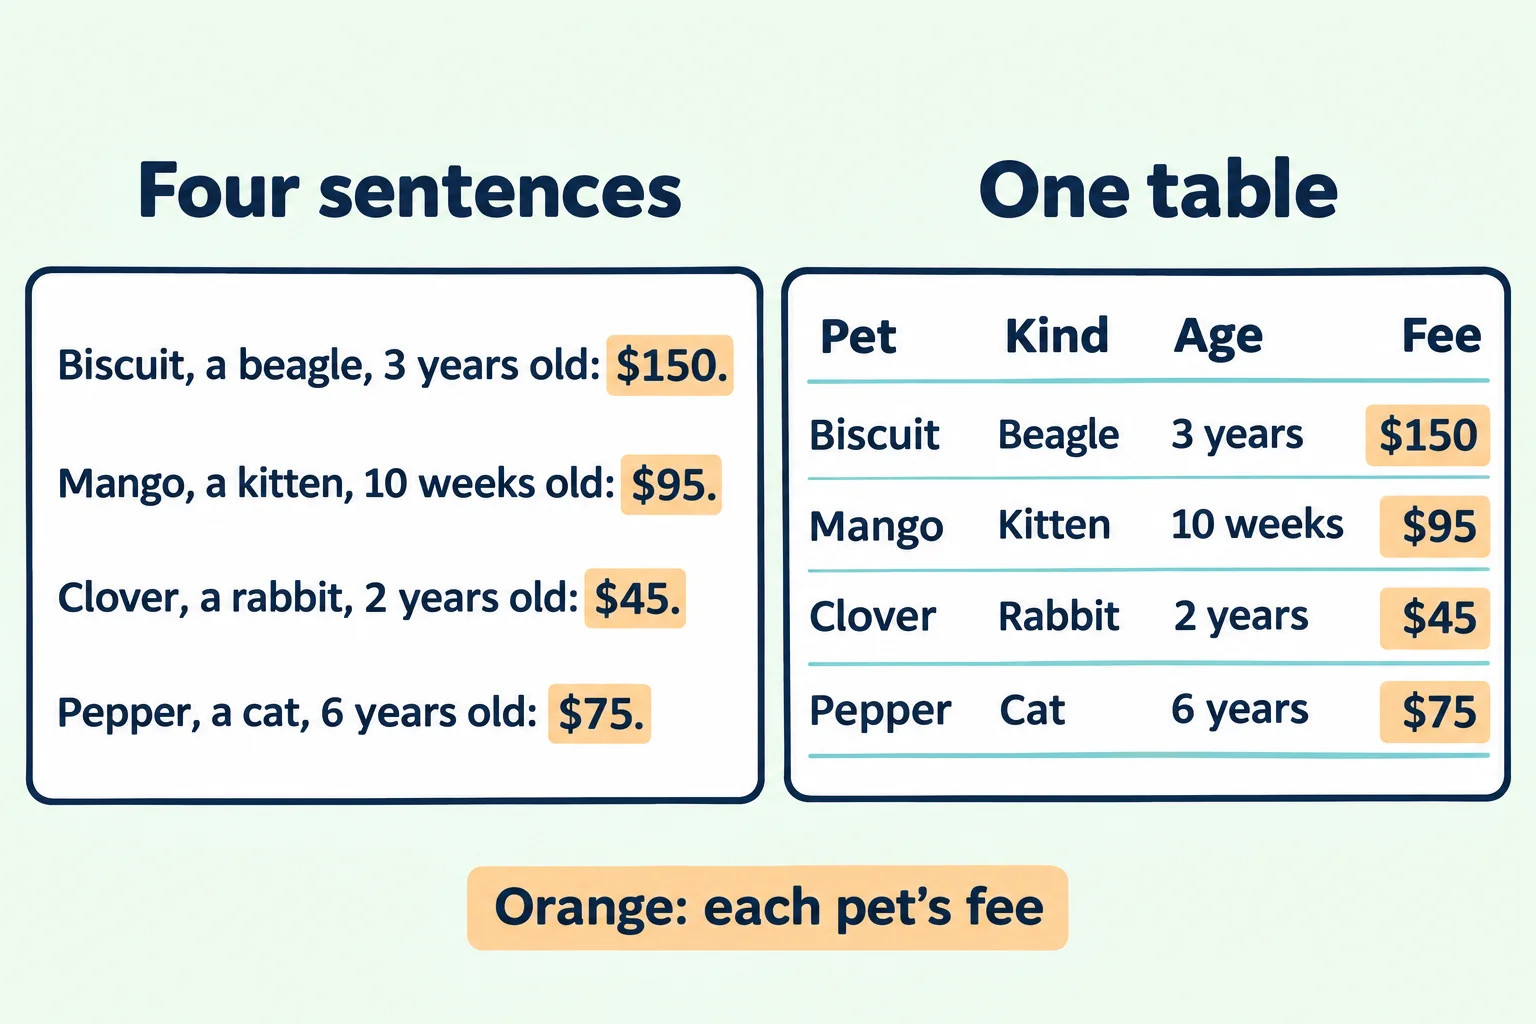
The first try is a paragraph for each pet:
<p>Biscuit, a beagle, 3 years old: $150.</p>
<p>Mango, a kitten, 10 weeks old: $95.</p>
<p>Clover, a rabbit, 2 years old: $45.</p>
<p>Pepper, a cat, 6 years old: $75.</p>
It's all there, but try answering "which pet costs the least?" Your eyes hunt along every line for the dollar sign, because the fees sit at a different place in each sentence. The second try is a list, one pet per <li>, and it has the same problem: a list is one column of similar things, and these facts don't line up.
Look at the data again. Every pet has the same four facts: name, kind, age and fee. Draw it on paper and you'd draw a grid: one row for each pet, one column for each fact, with the facts' names across the top. That's a data table: rows and columns that mean something together, where you read across to learn about one pet and down to compare one fact for all of them.
The test is that grid. If the data has headings across the top and things down the side, and a cell only makes sense with both (the $95 is Mango's fee), it's a table. If it's one column of things of the same kind, such as the menu links or the pet cards, it's a list.
Writing a table, read aloud
Here's the fee table in HTML:
<table class="fees">
  <caption>Adoption fees</caption>
  <thead>
    <tr>
      <th scope="col">Pet</th>
      <th scope="col">Kind</th>
      <th scope="col">Age</th>
      <th scope="col">Fee</th>
    </tr>
  </thead>
  <tbody>
    <tr>
      <th scope="row">Biscuit</th>
      <td>Beagle</td>
      <td>3 years</td>
      <td>$150</td>
    </tr>
    <tr>
      <th scope="row">Mango</th>
      <td>Kitten</td>
      <td>10 weeks</td>
      <td>$95</td>
    </tr>
    <tr>
      <th scope="row">Clover</th>
      <td>Rabbit</td>
      <td>2 years</td>
      <td>$45</td>
    </tr>
    <tr>
      <th scope="row">Pepper</th>
      <td>Cat</td>
      <td>6 years</td>
      <td>$75</td>
    </tr>
  </tbody>
</table>
Read it from the outside in:
<table>holds the whole table.<caption>is the table's title, Adoption fees. It goes first, right inside<table>, and a screen reader announces it with the table.<thead>, read "T head", holds the heading row, and<tbody>, read "T body", holds the rows of data.<tr>, read "T R", is a table row. Every row is a<tr>, the heading row too.<th>, read "T H", is a table header cell: a label that says what other cells hold. Fee labels the column under it; Mango labels the row beside it.<td>, read "T D", is a table data cell: one value, such as$95.
The scope attribute says which way a <th> points: scope="col" for a heading over a column, scope="row" for a heading at the start of a row. A screen reader uses it to name the cells as its user moves through the table, so the $95 is read with Fee and Mango, not as a number on its own. The exact words depend on the program.
Try it. In your adoption-list folder, make fees.html with a page skeleton, a <style> element and the table above, and open it with Live Server. With no CSS, the browser draws no lines at all, makes the headings bold and centers them, and puts the caption in the middle above the table.
Lines between the cells: border-collapse
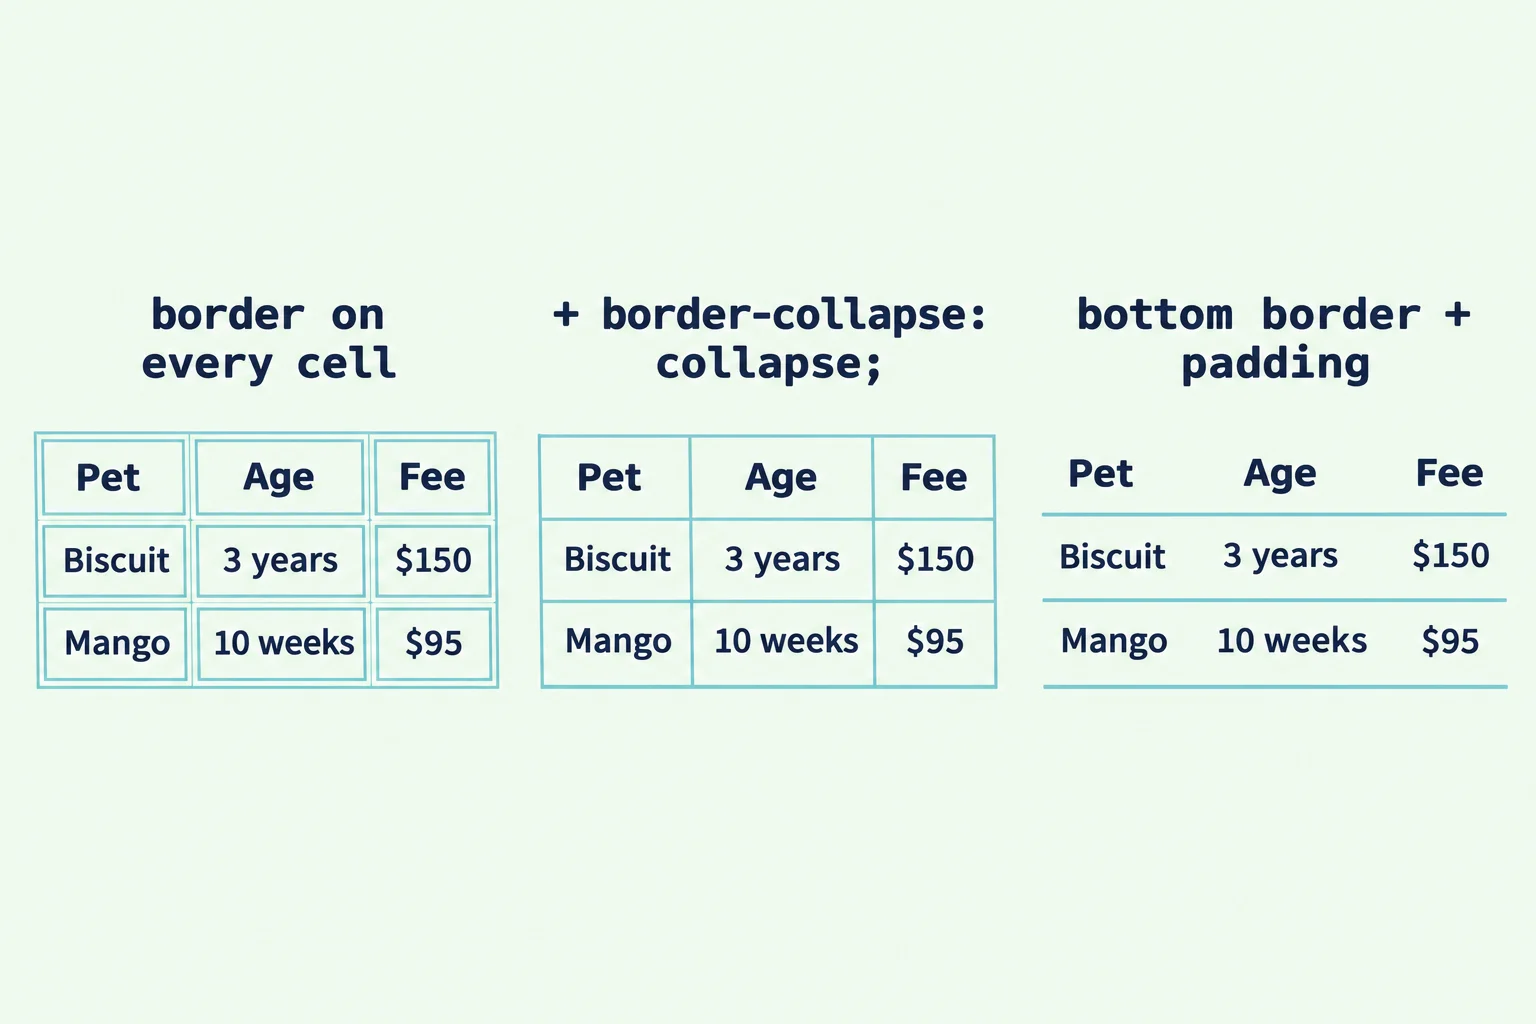
The first try at lines is a border on every cell:
.fees th,
.fees td {
  border: 1px solid #a8dadc;
}
Every cell gets its own box, with a small gap between each pair, so each line is drawn twice, like a sheet of stamps. The browser keeps a little space between table cells unless you tell it not to. border-collapse: collapse on the table merges each pair of neighboring borders into one line:
.fees {
  border-collapse: collapse;
}
That's the grid most tables need. Many look calmer still with a line between the rows only, and none down the columns, like the lines on a sheet of notebook paper. Swap the full border for a bottom border, and give every cell some padding, so the data has room:
.fees th,
.fees td {
  padding: 8px 12px;
  border-bottom: 1px solid #a8dadc;
}
Words on the left, numbers on the right
The browser centers the heading cells and starts the data cells on the left, so the headings don't line up with the words under them. Put every heading on the left, the way people read:
.fees th {
  text-align: left;
}
Numbers are different. In a column of fees, the digits should line up the way they do in a bill or a bank statement, ones under ones and tens under tens, and that happens when they line up on the right. The fee is the last cell in each row, so :last-child from Pseudo-Classes: :hover, :focus-visible, :nth-child() and More reaches it, and its heading:
.fees td:last-child,
.fees th:last-child {
  text-align: right;
}
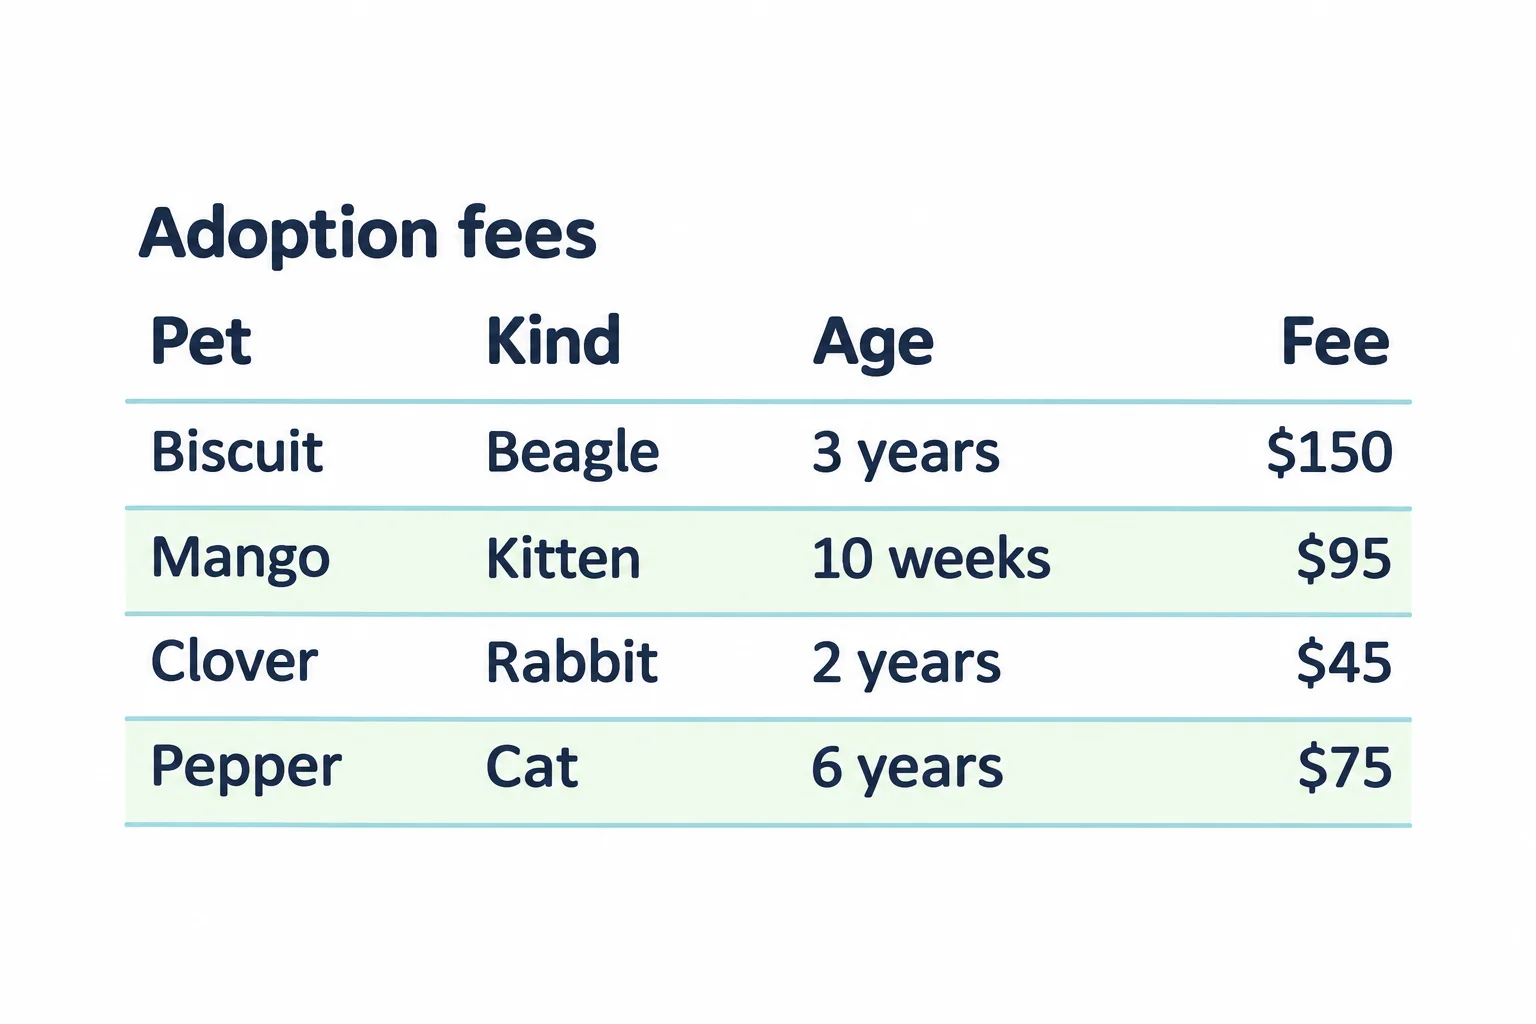
Now $150, $95, $45 and $75 end at the same edge, and Fee sits right above them. The caption gets the same treatment: caption { text-align: left; font-weight: bold; } puts the title at the table's left edge, in line with everything else.
Stripes that guide the eye
On a wide table, the eye can slip to the wrong row on its way across. Shading every other row keeps it on track, like the rows of a spreadsheet:
.fees tbody tr:nth-child(even) {
  background-color: #f1faee;
}
Read it as "every even row in the table's body". :nth-child() counts each row among the rows beside it in the same group, so Mango and Pepper, the second and fourth rows of <tbody>, are shaded. The tbody in the selector keeps the heading row out of it: that row is the first child of <thead>, so .fees tr:nth-child(odd) would shade it along with Biscuit and Clover. With tbody, only data rows are ever striped, whether you choose even or odd.
A table too wide for a phone
The shelter's visiting schedule has a column for every day the shelter is open, Tuesday to Sunday, so it's seven columns wide with the times. On a phone 375 pixels wide, a table that wide can't shrink to fit, so it pushes past the edge of the screen and the whole page slides sideways.
The fix is a box around the table that scrolls on its own, with overflow-x from Normal Flow and the display Property:
<div class="table-box">
  <table class="schedule">
    <caption>Visiting hours</caption>
    <thead>
      <tr>
        <th scope="col">Time</th>
        <th scope="col">Tuesday</th>
        <th scope="col">Wednesday</th>
        <th scope="col">Thursday</th>
        <th scope="col">Friday</th>
        <th scope="col">Saturday</th>
        <th scope="col">Sunday</th>
      </tr>
    </thead>
    <tbody>
      <tr>
        <th scope="row">Morning</th>
        <td>10 to 12</td>
        <td>10 to 12</td>
        <td>10 to 12</td>
        <td>10 to 12</td>
        <td>10 to 12</td>
        <td>Closed</td>
      </tr>
    </tbody>
  </table>
</div>
.table-box {
  overflow-x: auto;
}
The page stays as wide as the phone, and only the box scrolls sideways when the table is wider than it, with a scroll bar of its own. On a wide screen, where the table fits, nothing changes.
One last thing tables are not for: laying out a page. Long ago, sites used a big table to put a sidebar beside the content. Don't: a screen reader announces every "row" and "column" of it as data. The layout tools later in this module, flexbox and grid, do that job.
Try it. Add the CSS from each section to fees.html, one rule at a time, saving after each. Then add a fifth pet, Waffles, a 4-year-old corgi mix whose fee is $120, as a new row: the stripes move by themselves.
Do it: make the supply drive easy to read
Paws & Whiskers is running a supply drive, and its table of what's still needed is hard to read: the line under each row is broken into pieces, one per cell, the values are cramped, and the numbers don't line up. Fix it before the flyer goes out:
- The line under each row drawn as one line, with no gaps between the cells.
- Every cell with
8pxof room above and below its words and12pxat the sides. - The numbers in the last column, and their heading, lined up on the right.
- A pale green stripe,
#f1faee, on the first, third and so on of the data rows. The heading row isn't striped.
Practiced live on the lesson page: write the CSS right there and check it.
Check yourself
2 questions to try on the lesson page.
So what
When data is a grid of facts, a table lets people read across and compare down, and a screen reader can name every cell. A handful of rules (collapsed borders, padding, aligned numbers, stripes and a box that scrolls) makes it quick to read. The next topic keeps its headings in view while it scrolls.